Hey there Teacher Tappers!
The hot weather rumbles on, and last week a small number of primary and secondary teachers told us they had to use an early finish (3% and 5%). Uniform changes have continued (54% in primary and 79% in secondary), and bigger changes like cancelling or postponing events happened to around 15% of teachers in both phases. One Tapper wrote in to ask if other schools were offering optional early collections, something the Department for Education advised against in its guidance, and 7% of primary and 1% of secondary teachers told us this was used last week.
With more hot weather coming, we will be asking more about how schools are coping. We hope the fan is always pointing towards you, and the windows in your classroom are north-facing!
Prize draw holiday treat!
The last Teacher Tapp prize draw of this academic year, and we wanted to give you a prize that befitted the month! Therefore, one lucky Tapper is going to win £500 towards a summer break! To enter, just tapp between 8 July 2026 and 31 July 2026, and everyone who answers questions on Teacher Tapp, will be entered into the Teacher Tapp Prize Draw.
The winner will be alerted by a message in the app – so be sure to check in August to see if you scooped the prize!
Hot classrooms, more disruption?
At the end of June, as temperatures began to rise, when we asked our regular behaviour question, we found those teaching in classrooms that were “far too hot” were more likely to report disruptions when compared to teachers in classrooms that were “about right” (61% vs 44% in primary and 49% vs 36% in secondary).
We have repeated the experiment and found that classroom teachers were once again more likely to report poor behaviour if they were in hotter classrooms: 50% vs 39% for primary teachers and 39% vs 32% for secondary teachers.
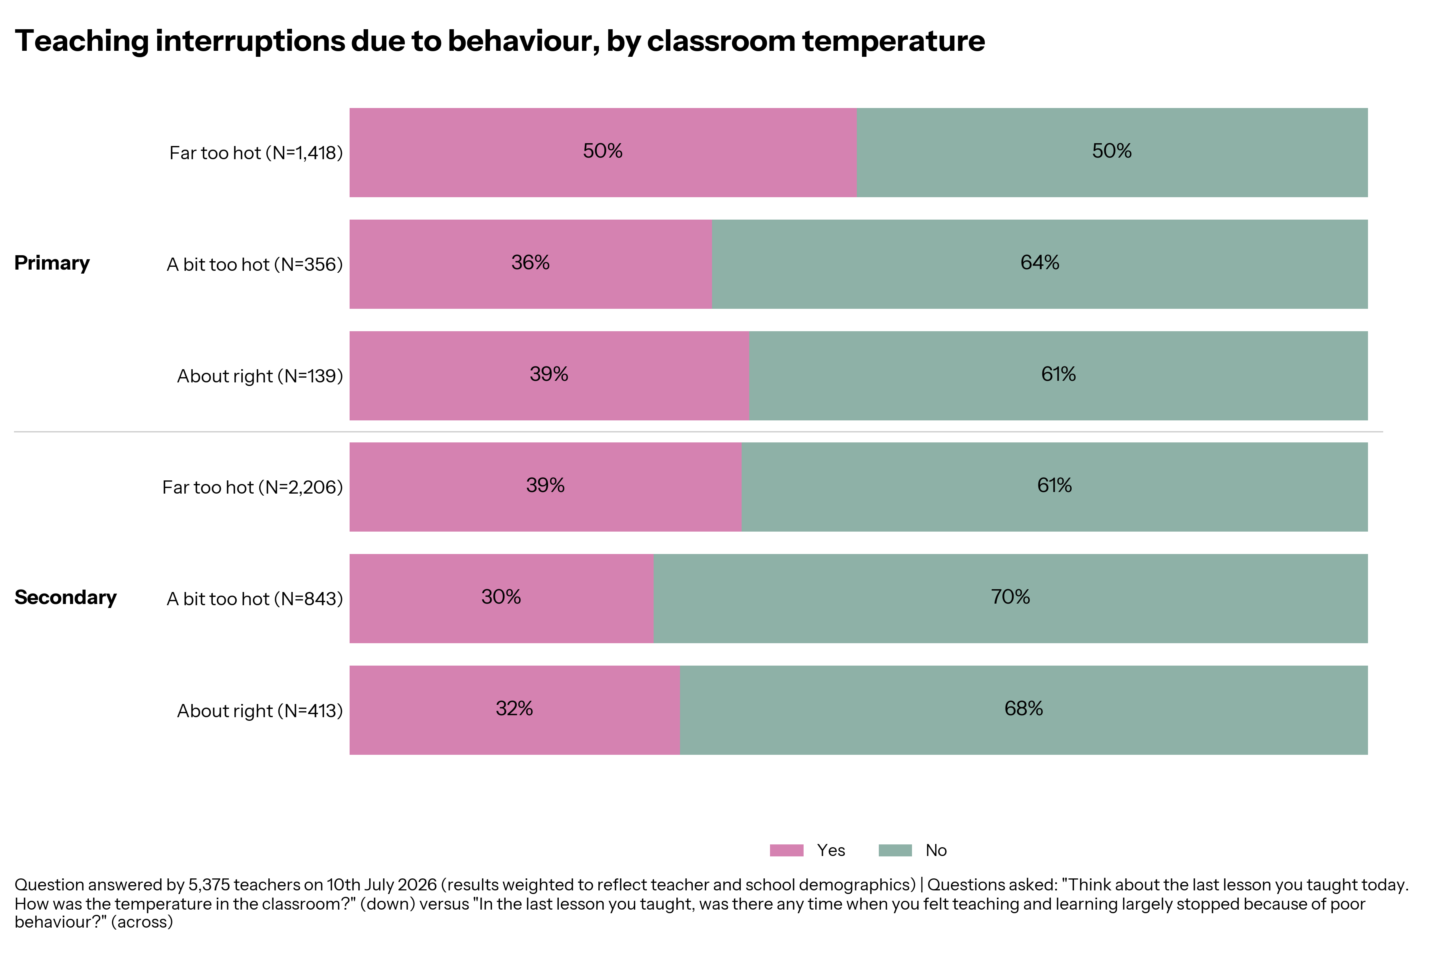
The main difference this time is that the number of teachers reporting disruptions is smaller compared to June (a 5 percentage point drop for both phases), but also the proportional gaps between those in “too hot” and “about right” classrooms have shifted – in short, the temperature of the classroom has made a difference, but less of a difference when compared to June, when we were right at the start of the heatwave.
Those in “too cold” classrooms were too small in number to include this time, so they have been excluded BUT we plan to keep asking this through the year when classroom temperature starts to change again – so keep an eye out for more classroom climate questions!
Anger over the pay deal
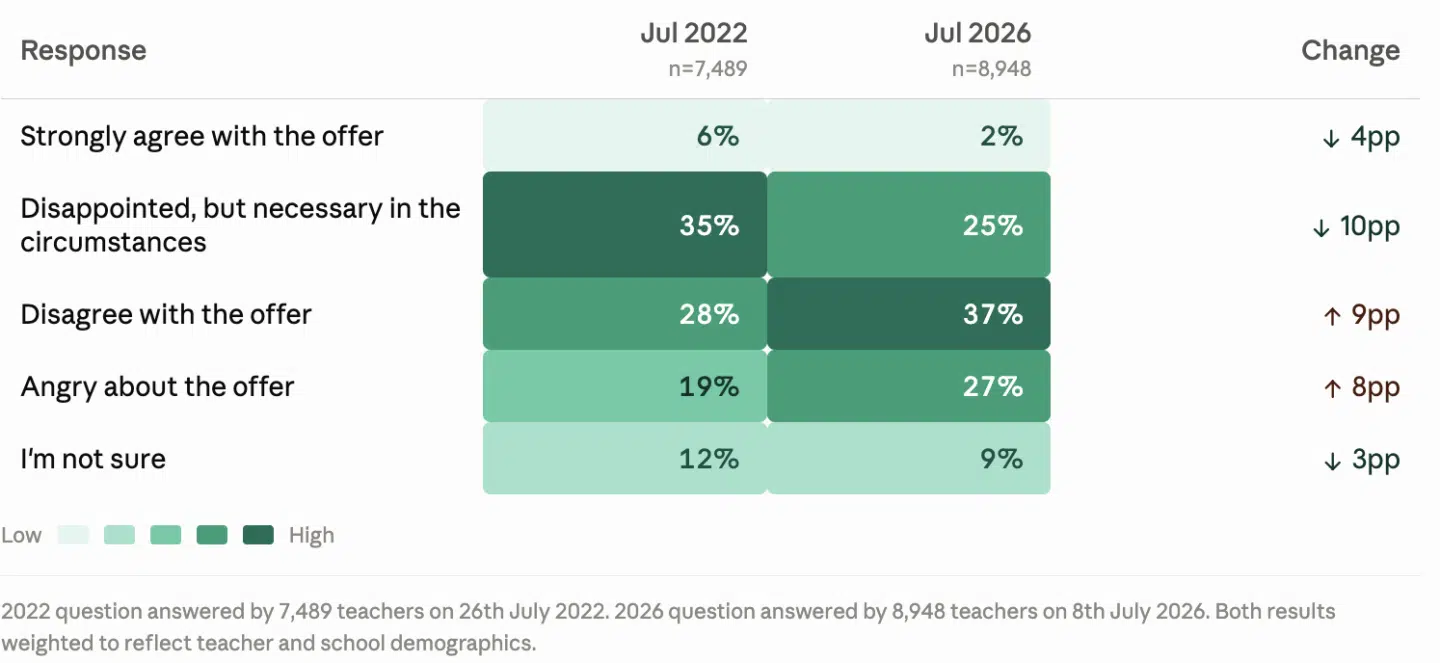
Last week, we reported the results of a way to judge the reaction of the teachers is to compare it to previous years. In July 2022, we asked teachers, “How do you feel about the overall proposed 2022/23 teachers’ pay award of 5%?”, and found 6% strongly agreed with the offer, 35% felt disappointed but thought it necessary in the circumstances, 28% disagreed with the offer, 19% felt angry about the offer, and 12% felt unsure.
Following the July 2022 pay deal, teachers took strike action, and with more angry teachers this year, teaching unions might expect a stronger turnout when their ballots go out later this year.
Teachers…how’s it going?
The end of the year is near (or for some, already here!), but how has the year felt for teachers?
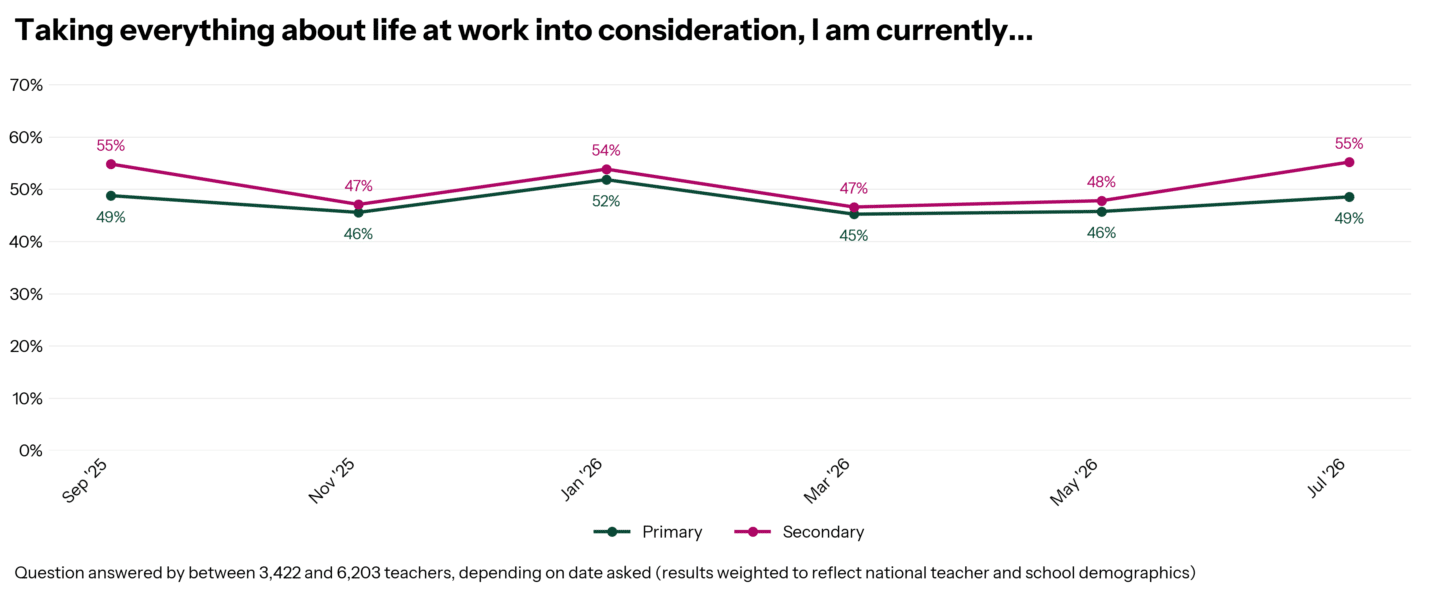
If I could add little rollercoaster carts to this graph, I would! The ups and downs of the year can be tracked here, with the number of teachers giving themselves a 7, 6 or 5 out of 7 for contentment, suggesting a good level of satisfaction with work.
55% of secondary and 49% of primary gave themselves 5 or more out of 7 for contentment for July, a 3 percentage point increase on May for primary teachers, but a 7 percentage point increase for secondary.
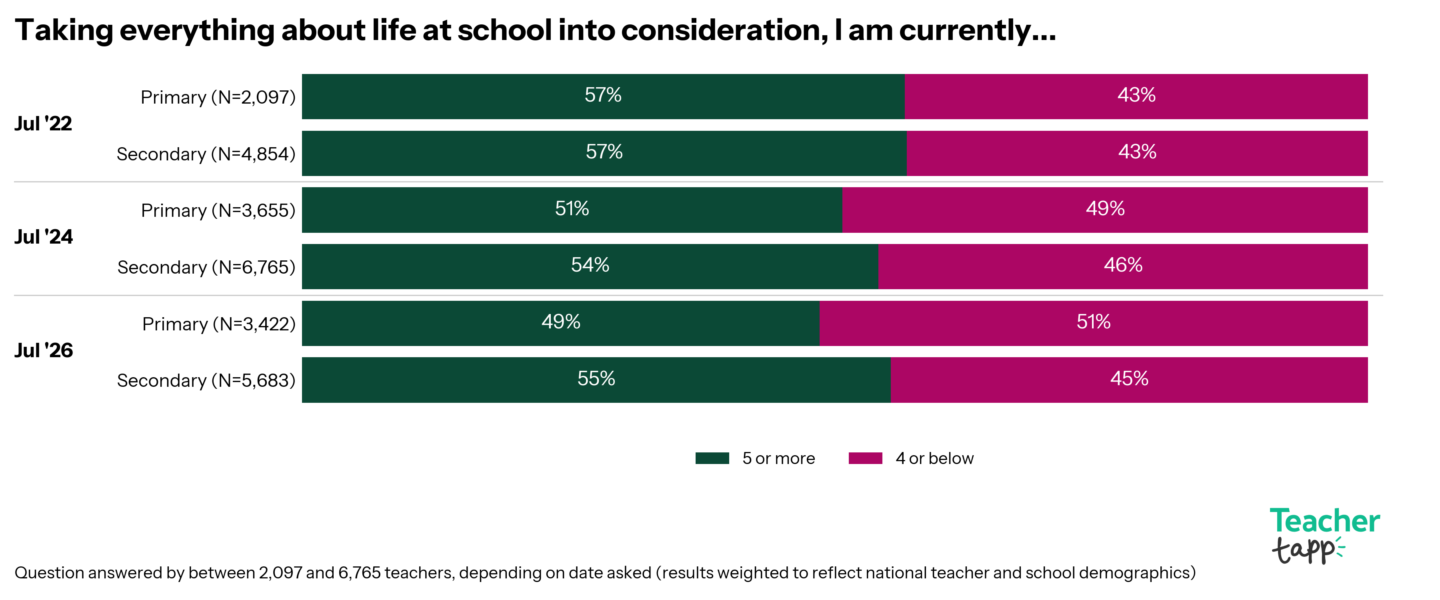
It makes sense that now the academic year has come to an end, teachers might be feeling more upbeat, but why the difference between the phases? If we look back to previous years, the gap between the two phases wasn’t as pronounced as it is this year: in July 2024, there was a three-percentage-point gap, and in 2022, there was no gap at all.
What could be the cause of the lower contentment levels among primary teachers? One issue this year that has added to the workloads of senior leaders might be the delay in the KS2 Sats results: 95% of leaders told us they had extra work to do, with 75% saying this would spill into the holidays.
Do you have your own theory on this difference? Tell us! Email England@teachertapp.co.uk 📧.
A Teacher Tapper asked…
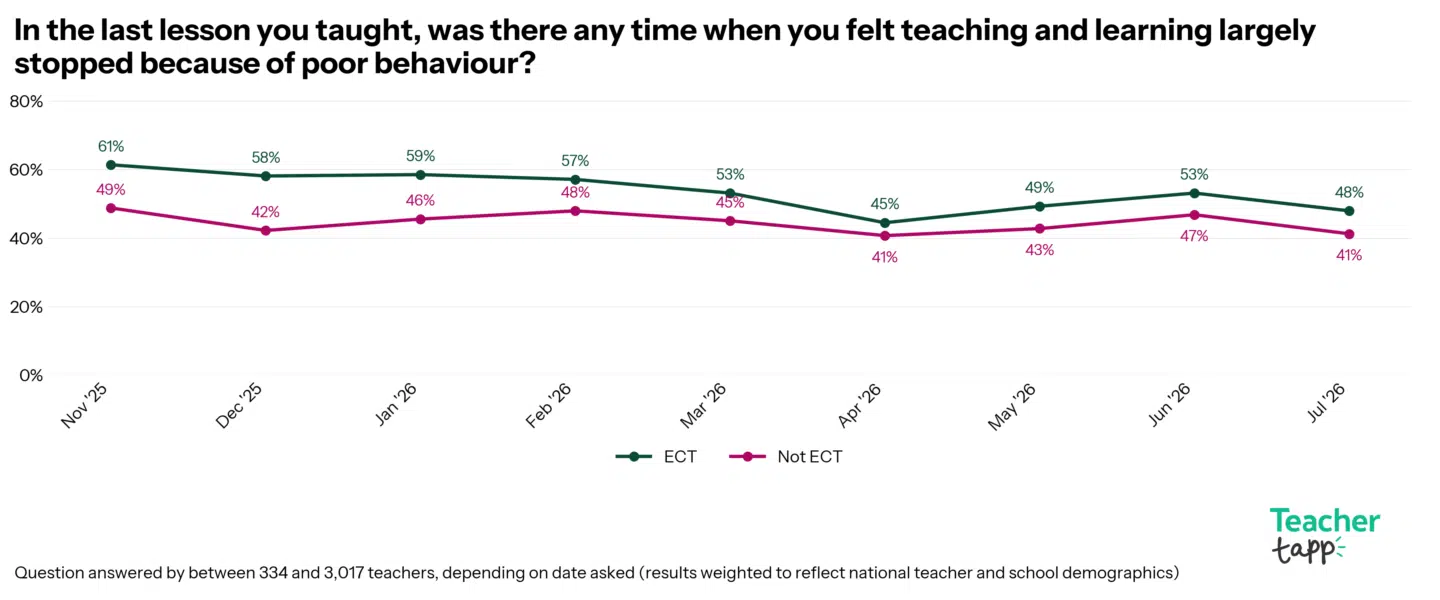
This week a Tapper wrote in to ask if we had an update to our data on the difference in behaviour disruptions for ECTs and non-ECT classroom teachers. The good news: yes, we do! The more good news: the gap between the experience of ECTs and non-ECT classroom teachers has remained stable.
The wide 16-point gap seen at the start of the year, where far more ECTs had disrupted lessons compared to non-ECT classroom teachers (58% vs 42% in December) but over the year slowly closed to just 4-percentage points in April (45% vs 41%). However, May saw an increase in disruptive behaviour, and a widening of the gap (49% vs 43%), and June behaviour deteriorated again (53% vs 47%), both with gaps of 6 percentage points. The not-too-disheartening news! The gap this time has remained steady AND (definitely good news) there has been a drop in poor behaviour (48% vs 41%, 7 percentage points).
What does this mean? One interpretation could be that at the start of the ECT, behaviour is much trickier for ECTs when compared to more experienced non-ECT classroom teachers – but things get better quickly. But as the academic year progresses, challenge increases and requires a different set of behaviour management skills: working with students in hot classrooms, or individuals finding exam pressure tough, or motivating unmotivated learners are very different in the summer term compared to the Spring and Autumn.
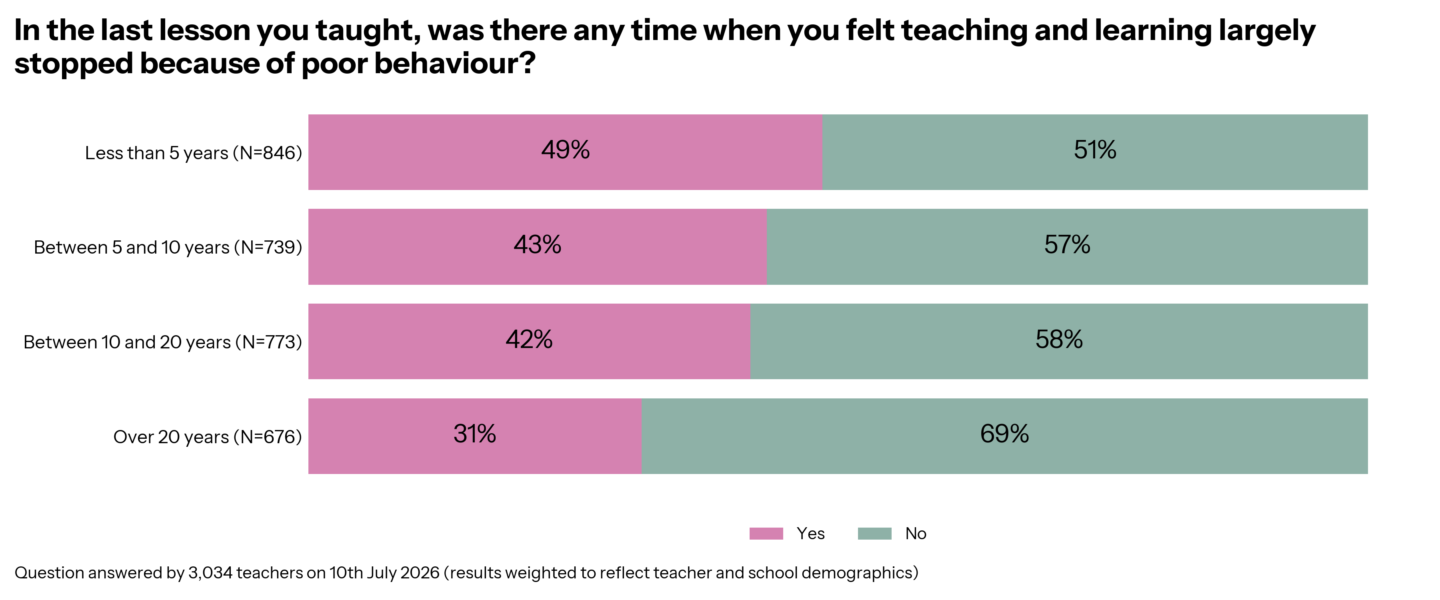
But if the 6-percentage-point gap is there at the start of the year, what does it look like for teachers with more experience? You probably won’t be shocked to learn the longer you have been in the classroom, the less disruption you face. And things really start to get better when you have been teaching for more than five years. In July, 43% of classroom teachers with 5 – 10 years of experience reported disruptions, dropping to 42% for those with 10 – 20 years of experience, and then just 31% for those with 20 + years. So the good news is, things do get better the longer you do them!
Daily Reads
This week, it was DISPLAYS that got you clicking! If you want to read the blog that 1,200 other Tappers clicked this week (and gave 4 stars out of 5!) then here it is.
There are so many great blogs out there and we love featuring them on Teacher Tapp. If you have a blog you think we should feature, then please email us at england@teachertapp.co.uk and we will check it out!