Hey there Teacher Tappers!
October is here, and that means, for most of you there will be a half-term holiday this month! Look out for questions about how long it is and what your plans are soon…👀
Refer a friend to join Teacher Tapp – both get a sausage roll!
Know a teacher who’d enjoy Teacher Tapp? For a limited time only, when you invite them using the referral button in the app, you’ll both get 100 points – enough for a Greggs sausage roll each.
How it works: 1. Open Teacher Tapp and tap the referral button (megaphone emoji in the top right-hand corner). 2. Share your invite with a teacher friend. 3. Once they’ve signed up and answered their questions, you’ll each get 100 points. Then pop to the Reward Store and swap them for a sausage (or chicken or vegan!) roll. Lovely 😋. But be quick – offer ends Monday 12th October.
Teacher Tapp on the road! 🧭
This Saturday, Teacher Tapp will be heading to Birmingham to join English teachers at the AQA Assessment Reform conference, armed with our Higher or Lower stats game plus special Teacher Tapp merch. If you’re also heading there, do come and say hello!
And we’re heading back to Birmingham again (any Tappers in Birmingham – recommendations for where to visit are very welcome!) for the Schools and Academies show on the 18th and 19th of November. This time we will have a stand to share our findings and give out badges and goodies plus members of the team will be taking part in talks. It’s not too late to register, and if you’re a teacher you get a free ticket here.
Learning disruption from behaviour by year group
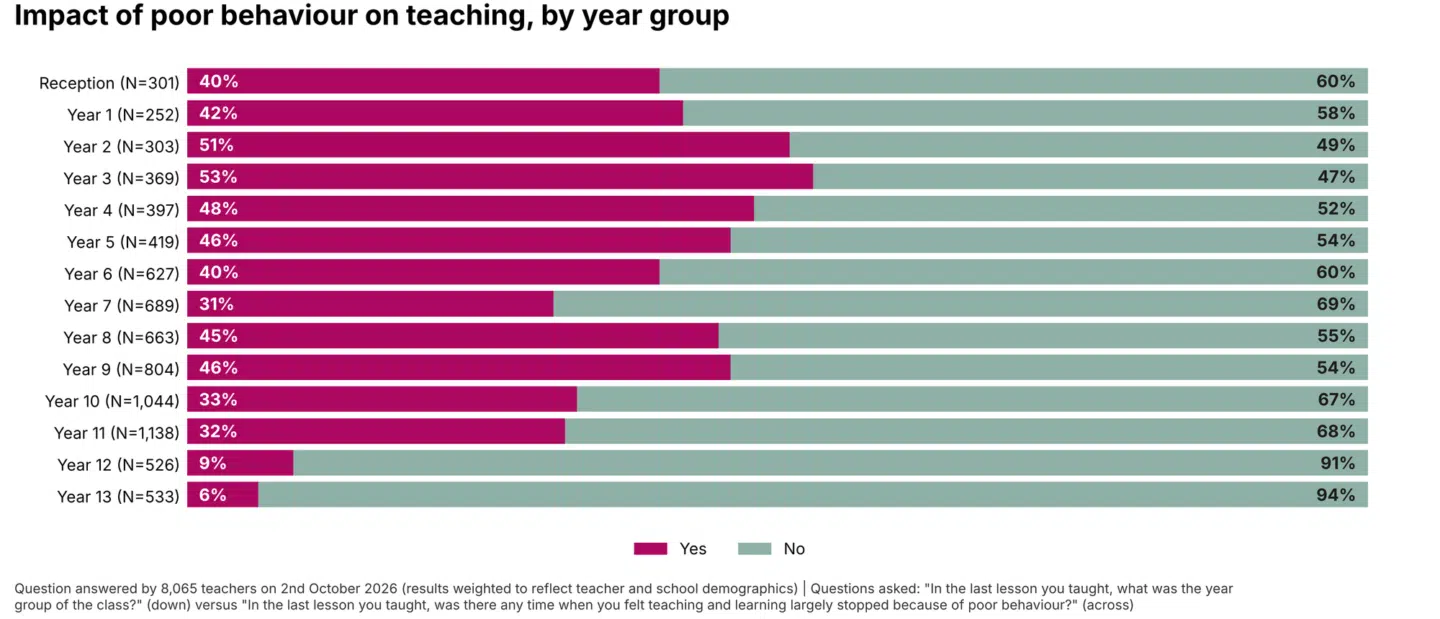
When we last asked our question about lesson disruption, a Tapper got in touch to ask if we could do a breakdown by year group, to check what difference this made to the likelihood of a teacher reporting disruption. Your data wishes are our commands! So this is what it looks like:
Among primary teachers, it was Year 3 with the highest levels of disruption (53%); the lowest levels of disruption could be found at the two opposite ends of the school: Reception and Year 6 (40%).
Over in secondary, teachers of Year 9 had the highest levels of disruption, closely followed by Year 8 (46% and 45%), while teachers of Year 13 had far fewer disruptions (6%).
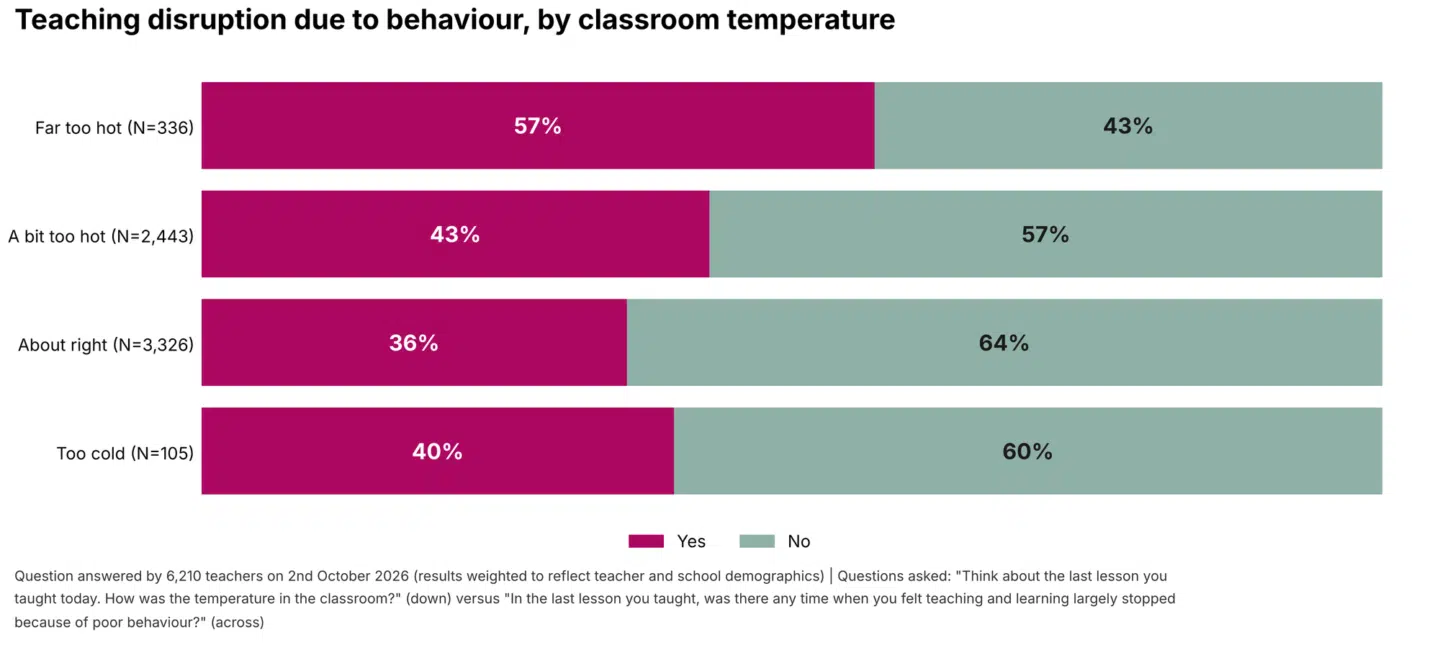
We’re also keeping track of temperature in the classroom and how this tracks with disruptive behaviour. Once again, teachers in hotter classrooms are more likely to report disruptive behaviour (57% vs 36% in ‘about right’ classrooms). As the seasons change, we will keep an eye on whether those in classrooms where they feel too cold are more or less likely to report disruptions to learning. At the moment, just a tiny number of teachers are feeling too cold, so this might take a few more months…
While on the topic of behaviour, this question might provoke some interesting discussion…
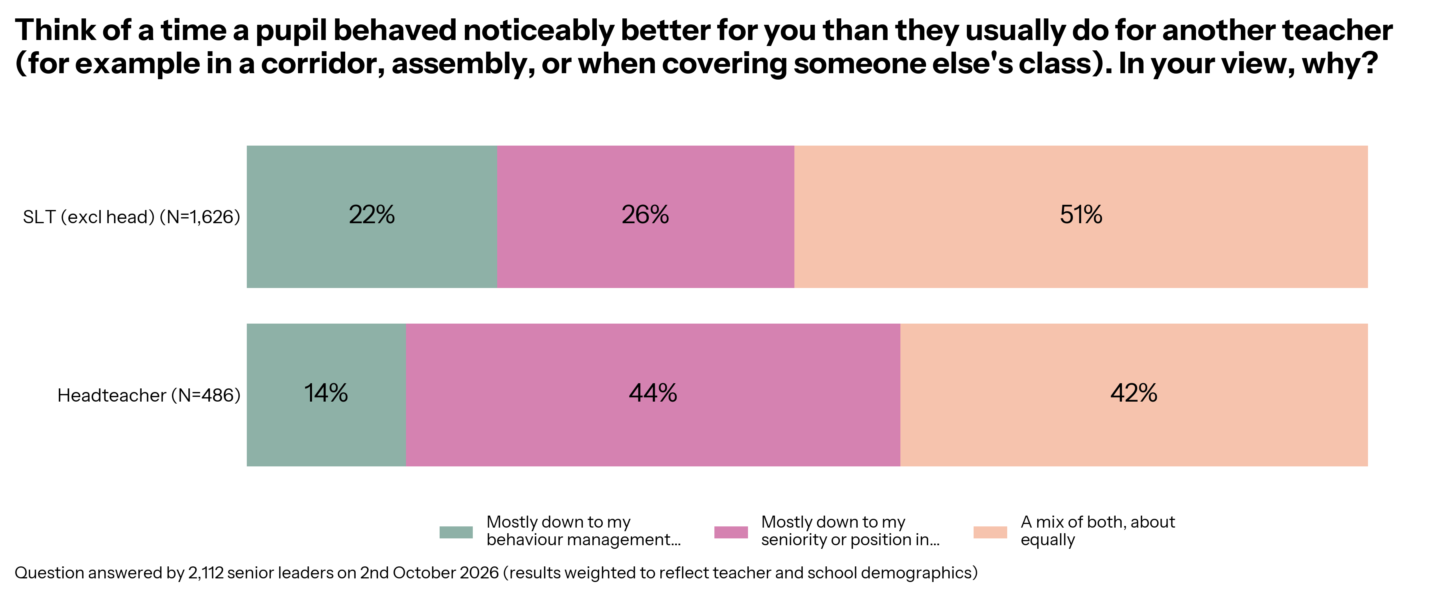
At the ResearchEd National Conference, one Tapper asked us to find out whether senior leaders thought pupils behaved better for them because of their status or their behaviour management skills..
When asked to recall a time a pupil behaved better for them than for another teacher, 22% of senior leaders (not including headteachers) said they felt it was due to their own behaviour management skills, 26% felt it was due to their seniority, and 51% an equal mix of the two.
Headteachers, however, were much more likely to attribute it to their seniority: 14% felt it was their behaviour management, 44% felt it was their seniority, and 42% thought it was an equal mix of the two.
Planning time
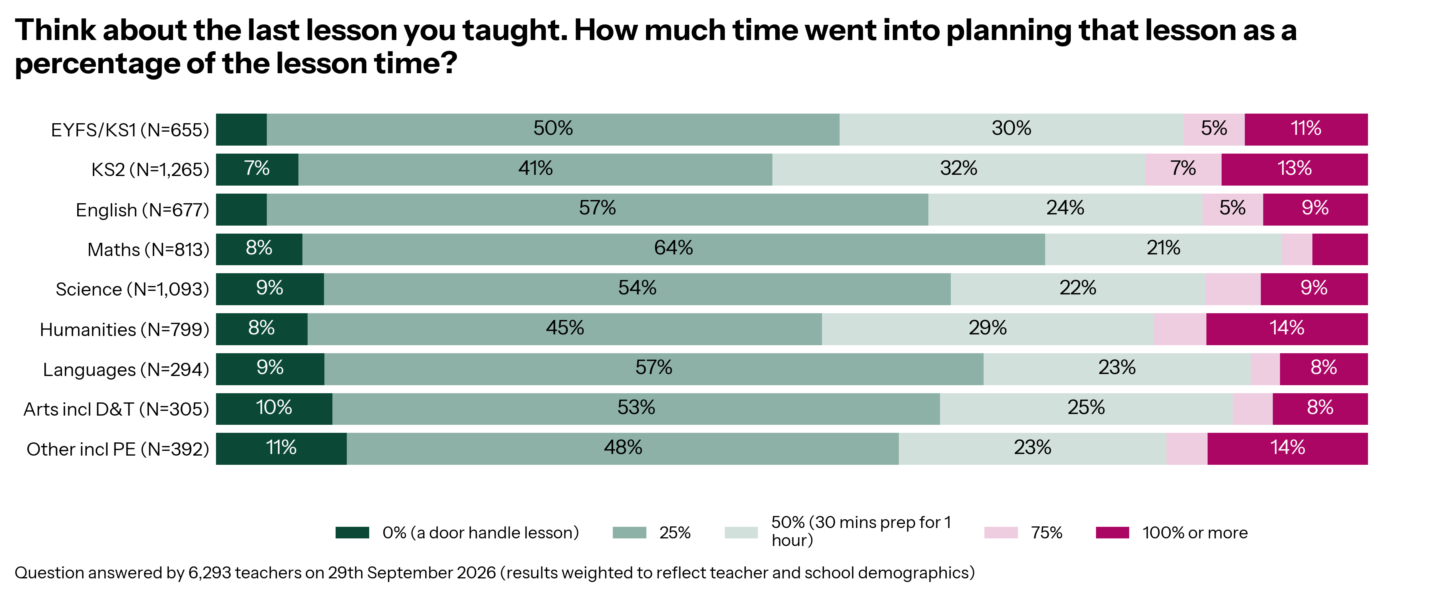
11% of secondary and 5% of primary teachers say planning is their favourite part of their job…but how long does it take to plan a single lesson?
When asked about the last lesson taught, the most common answer across all subjects and phases was 25% of the total lesson time (for a 60-minute lesson, 15 minutes of planning time).
Some teachers reported spending 100% of the total lesson time or more (for a 60-minute lesson, at least 60 minutes of planning time):
- Humanities and ‘Other including PE’ 14% spent 100% or more
- KS2 teachers 13% spent 100% or more
- EYFS/KS1 11% spent 100% or more
How are ECTs doing?
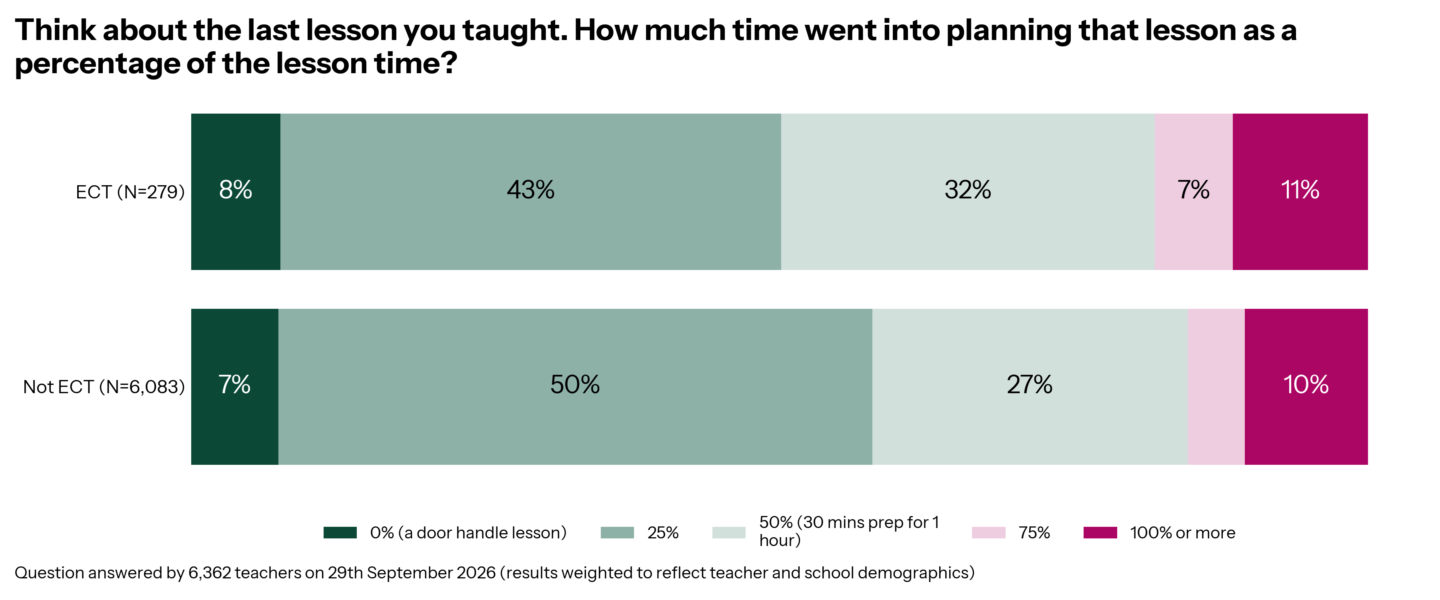
ECTs tend to spend more time on planning compared to non-ECT teachers.
50% of non-ECTs spent 25% of the total lesson time planning their lesson, but this was true for only 43% of ECTs.
AI predictions vs reality
In April 2023, the world was a different place. King Charles was preparing for his coronation. The passport office was on strike. The final series of Succession had just been released, and no one had even heard of Barbenheimer.
Back in 2023, AI was very different to how we know it now. The free version of ChatGPT handled text only. Image input, such as photos of handwritten scripts, wasn’t widely available until September 2023. It regularly “hallucinated”, confidently inventing statistics, quotes and references. It also had no live internet access in the free version, so its knowledge stopped in September 2021. It was also weak at arithmetic and couldn’t analyse a spreadsheet unless you pasted the data in – and even then it made errors.
Now we are three years on from that point; it feels like a good time to look back and compare how current use matches up with the predictions made by Tappers in 2023, when we asked how you expected AI would be used in the future.
Used far more than expected
Parent communications: In primary, senior leaders are using AI for parent communications far more than they expected. Its use is up 28 points, roughly doubling from about 28% to 56%. The picture is similar among secondary senior leaders, where it’s up 10 points.
Lesson planning in primary: Primary classroom teachers’ use of AI for planning is up 16 points (from 39% to 55%). Secondary is also above prediction for both groups, but only by 5 points.
Used far less than expected
Data analysis: These are the biggest falls on the chart. For AI analysis of attainment data, primary teachers were down 27 points (34% to 7%), and secondary teachers were down 25 points. AI analysis of behaviour data looks very similar with secondary leaders down 26 points and secondary teachers down to 24 points – down to almost nobody!
Marking in secondary: this was down 24 points for both teachers and leaders, from about a third to under 10%.
Homework: Using AI for homework was down across primary and secondary.
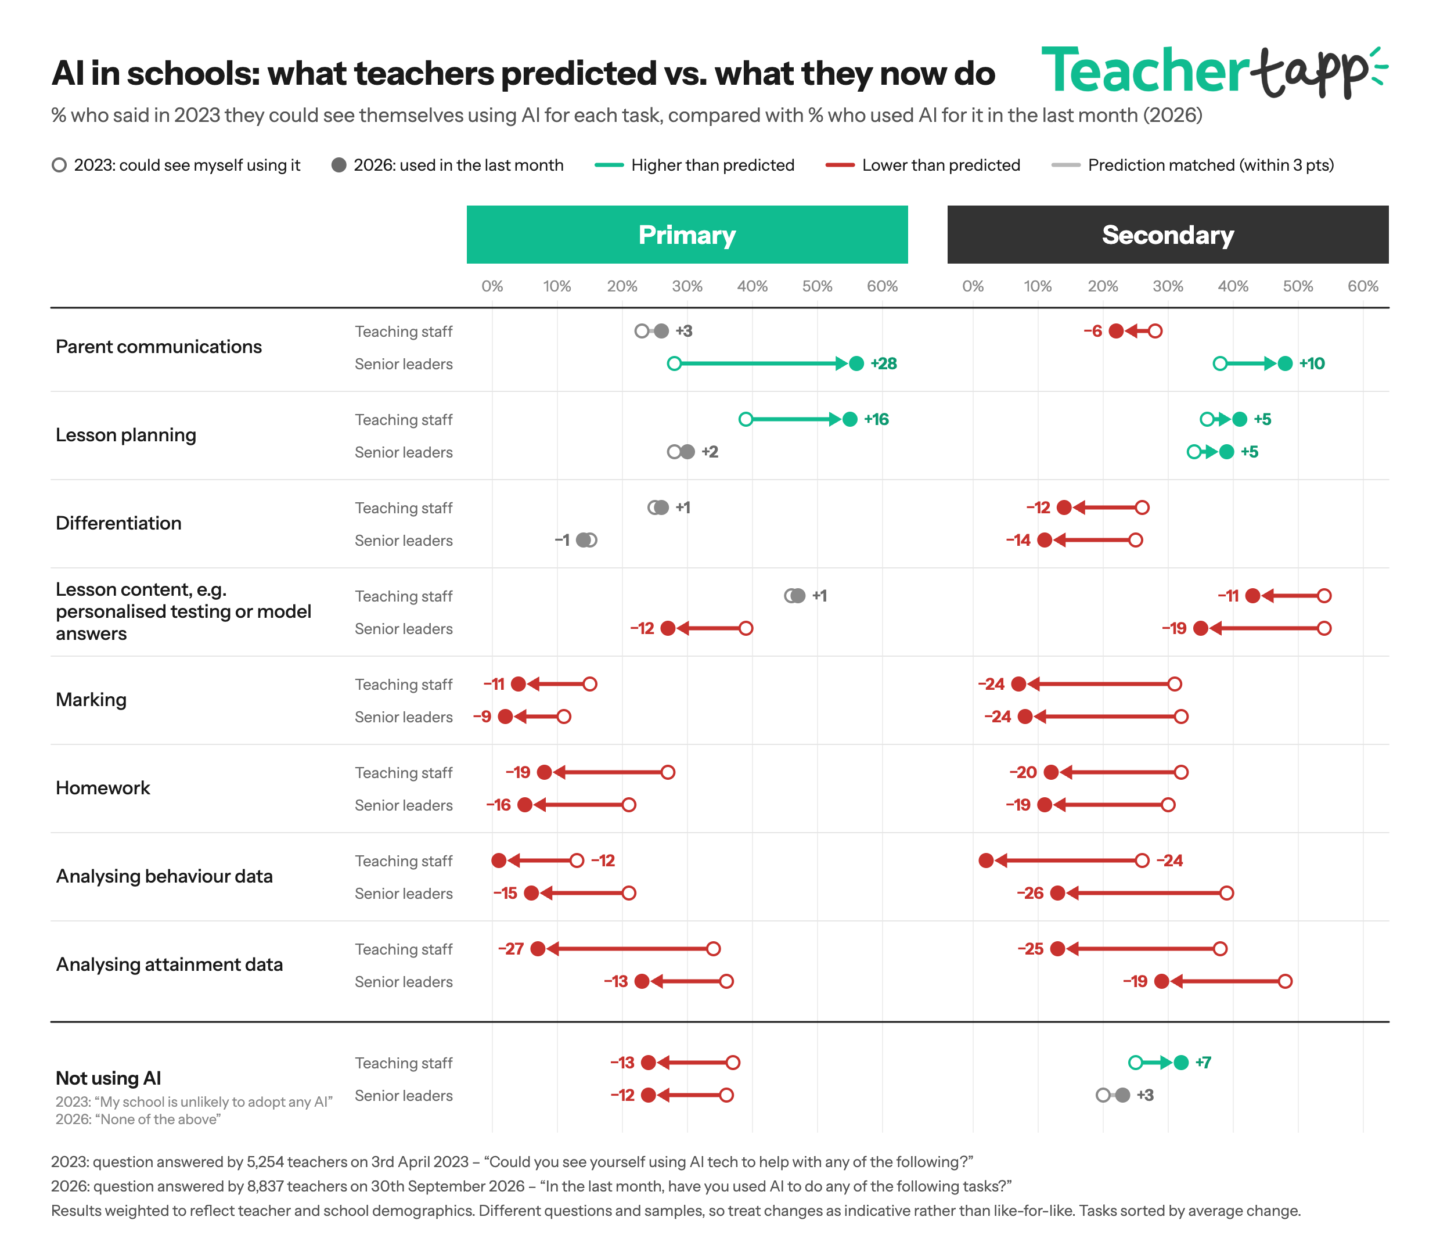
However, assessment and data tasks haven’t caught on like we thought they would (yet). The number of teachers reporting that they have used AI for marking, behaviour data and homework is lower than those who thought they would: 7% of secondary teachers used AI for marking vs 31% who thought they would.
Already, in three years, AI capabilities have changed hugely. So perhaps some of these predictions will prove to be correct; we just need to keep checking in!
Reception Baseline problems
The Reception Baseline Assessment has been administered to all new primary pupils who have just started school for the first time. This assessment replaced the KS1 SATs, and since its rollout has had updates to how it is administered.
This year, fewer teachers reported technical problems (23% vs 67% in 2025), but more teachers reported staffing or cover issues (44% vs 33%).
A Teacher Tapper asked…what age do teachers think children are old enough to be prosecuted for a crime?
A teacher Tapper got in touch after reading about a proposed change in the law regarding the age children are old enough to be prosecuted for a crime.
At the start of 2026, the new Chair of the Bar Council, Kirsty Brimelow KC, made her inaugural speech to the Bar. She said: “The age of criminal responsibility in England and Wales is 10 years old. It is the lowest in Europe. I have set up a working group to analyse the increasing of that age. We are rightly concerned about crime, victims and public safety. But the question is not ‘how do we punish’ but ‘how do we prevent a lifetime in the criminal justice system?’”
In June this year, a report was published: ‘Reviewing the minimum age of criminal responsibility.’ The report recommends that the current threshold should change from age 10 to 14.
But what do teachers think about this topic?
To ask the question, we tested something called ‘the anchoring effect’. This is when our minds grab hold of whatever figure is nearby and then adjust away from it. That starting point is called an “anchor”, and it can sway our answers even when we don’t realise it.
On 3rd October, we asked teachers: “At what age do you think a child should be old enough to be prosecuted for a crime?” Each teacher saw one of four versions of the question:
- the question on its own (30% chose 10, and 8% chose 14)
- the question, plus the fact that in England children can be prosecuted from the age of 10 (56% chose 10)
- the question, plus the fact that the United Nations recommends an age of at least 14 (20% chose 14)
- the question, plus both facts (34% chose 10, and 15% chose 14)
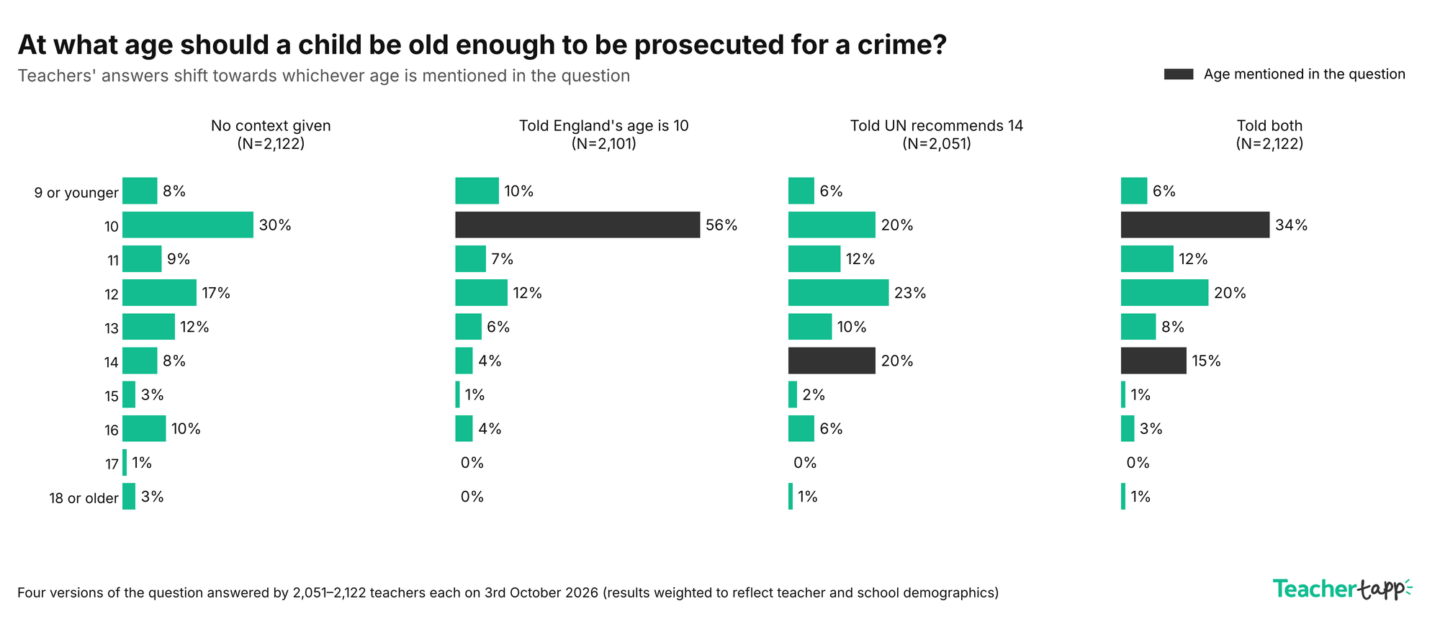
The question was the same every time. The only difference was which number teachers saw first. Being told about the law in England almost doubled the share choosing 10, and mentioning the UN recommendation more than doubled the share choosing 14. When teachers saw both numbers, 10 stayed the most popular answer, but the UN’s 14 still nearly doubled its share (8% → 15%). That’s anchoring in action, and it’s why we think so carefully about how we word our questions!
And when it comes to answering the Tapper’s question, it seems that in the version of the panel who had the question without context, 30% felt 10 was the right age, 8% thought it should be younger, and 63% thought it should be older.
Among the group who had all of the context, 34% thought 10 was the right age, 6% thought it should be younger, and 60% thought it should be older. We will have to wait and see if anything changes.
If you have a question you would like Teacher Tapp to check, get in touch and let us know! England@teachertapp.co.uk 📧
Ups and Downs of…supervising students around the school outside of lessons
This week, we asked: In your school, do you feel that any of these periods of the day need more staff supervision? Here is how responses have changed over time:
UP ⬆️ primary teachers saying lunchtime needs more supervision 71% UP from 55% in 2022.
DOWN ⬇️ secondary teachers saying after-school needs more supervision 12% DOWN from 16% in 2022.
UNCHANGED 🔁 Secondary teachers reporting that students need more supervision before school 15% in 2026 and 2022.
Daily Reads
The most-read tip was from Edapt on Staff WhatsApp groups!
There are so many great blogs out there, and we love featuring them on Teacher Tapp. If you have a blog you think we should feature, please email us at England@teachertapp.co.uk, and we will check it out!