Howdy Teacher Tappers!
Wow – the hot sticky weather continues, and heat warnings are being shared across the country. Here at Teacher Tapp, we’ve been checking in with you to see how the higher temperatures are impacting your work, and found out that teachers in the East of England were the most likely to report feeling “too hot” in their classroom on Friday (59%), and teachers in the South West were the least likely to report uncomfortable temperatures (19%). We’re going to be checking in to see what adjustments your school has made every day this week – so be sure to check the results in the app to see how your experience compares!
New prize draw
Here at Teacher Tapp we are incredibly grateful for all of the Tapps you give us. This month, Tappers shared their thoughts on the links between what students eat and their behaviour in the classroom, with 8 in 10 teachers reporting they believed unhealthy food impacted classroom behaviour. These opinions have been fed back to the Government via their consultation, so those making the policy decisions will have a clearer picture of what teachers really think.
But we could only do that because of YOU. Therefore, we feel it is only right that we regularly say THANK YOU, and this month one lucky Tapper will win an iPad! It’s easy to enter – you just have to Tapp in June! Check out the full Ts and Cs here.
Now, onto the new edu-findings…
Behaviour tracker: temperature in the classroom
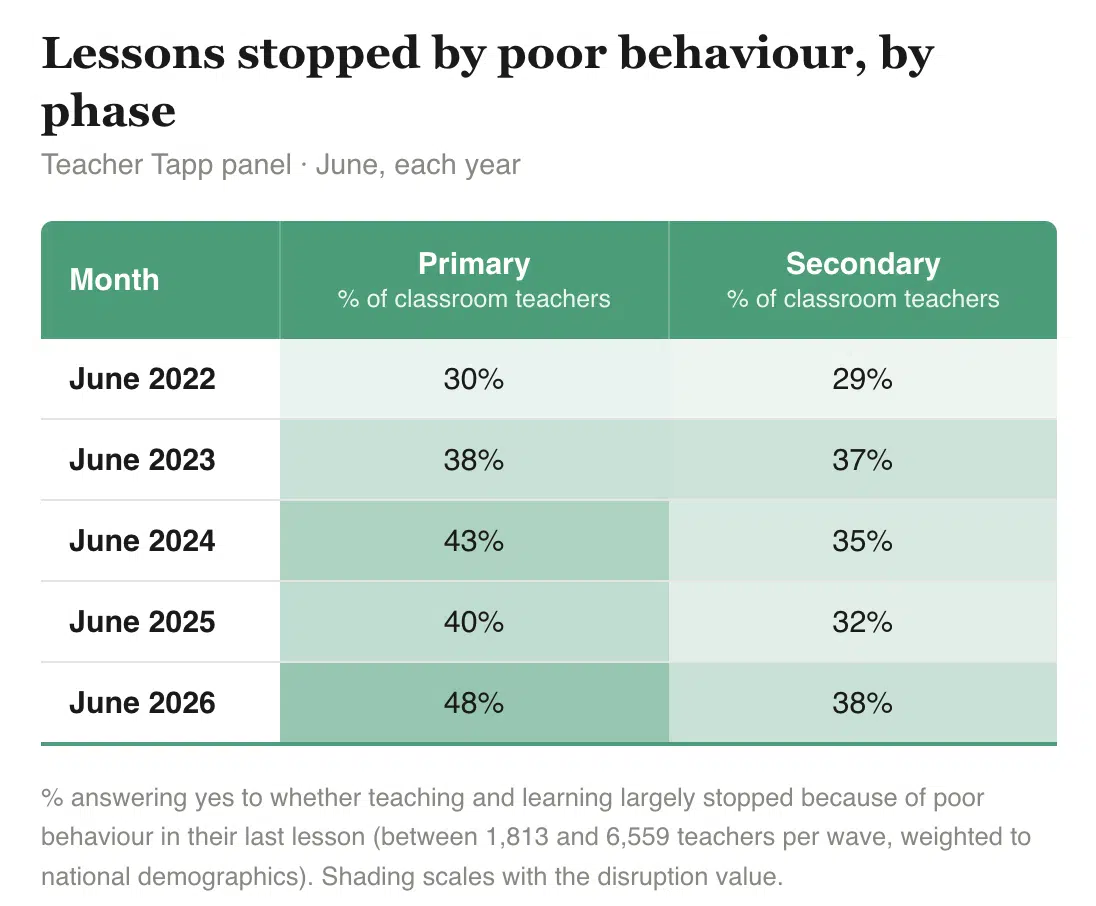
The behaviour tracker has been watching your reports of disrupted lessons, and classroom teachers reporting their last lesson experienced poor behaviour so disruptive learning stopped is UP versus last month: 48% in primary and 38% in secondary, an increase from 42% in primary and 32% in secondary when we asked in May.
So far this year, this is the highest report of disruption in secondary, and the second highest report in primary, just one percentage point lower than the 49% reported in November and February.
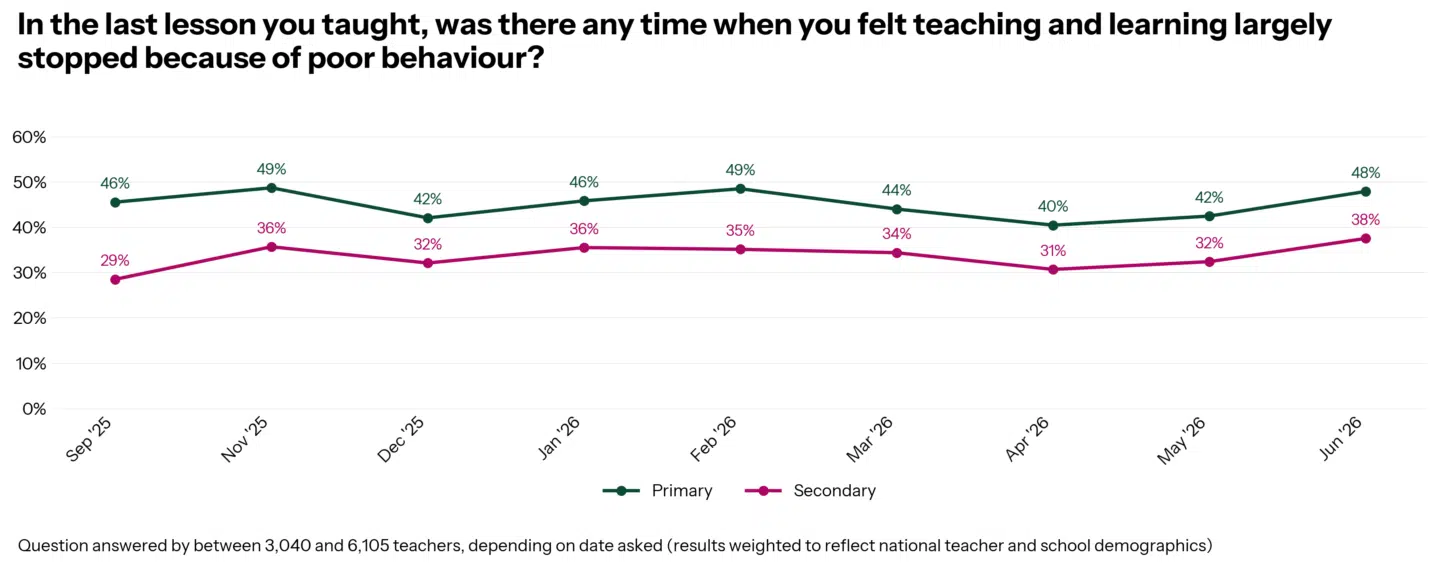
Is this normal? It’s slightly higher than what we have seen in the past: 2026 has the highest number of classroom teachers reporting disruption of any June to date. When we first asked about disruptions in the classroom in the month of June in 2022, 30% of primary and 29% of secondary classroom teachers reported that behaviour had stopped learning in their classroom. The second-highest figures came in June 2024 for primary (43%) and June 2023 for secondary (37%).
With weather forecasters predicting that this June is going to break records for high temperatures, we wondered if the weather was playing a part in this. To find out, we looked to see if teachers in warmer classrooms faced more disruptions. To do this, we asked classroom teachers about the temperature in their classroom – and those teaching in classrooms that were “too hot” were more likely to report disruptions when compared to teachers in classrooms that were “about right” (61% vs 44% in primary and 49% vs 36% in secondary).
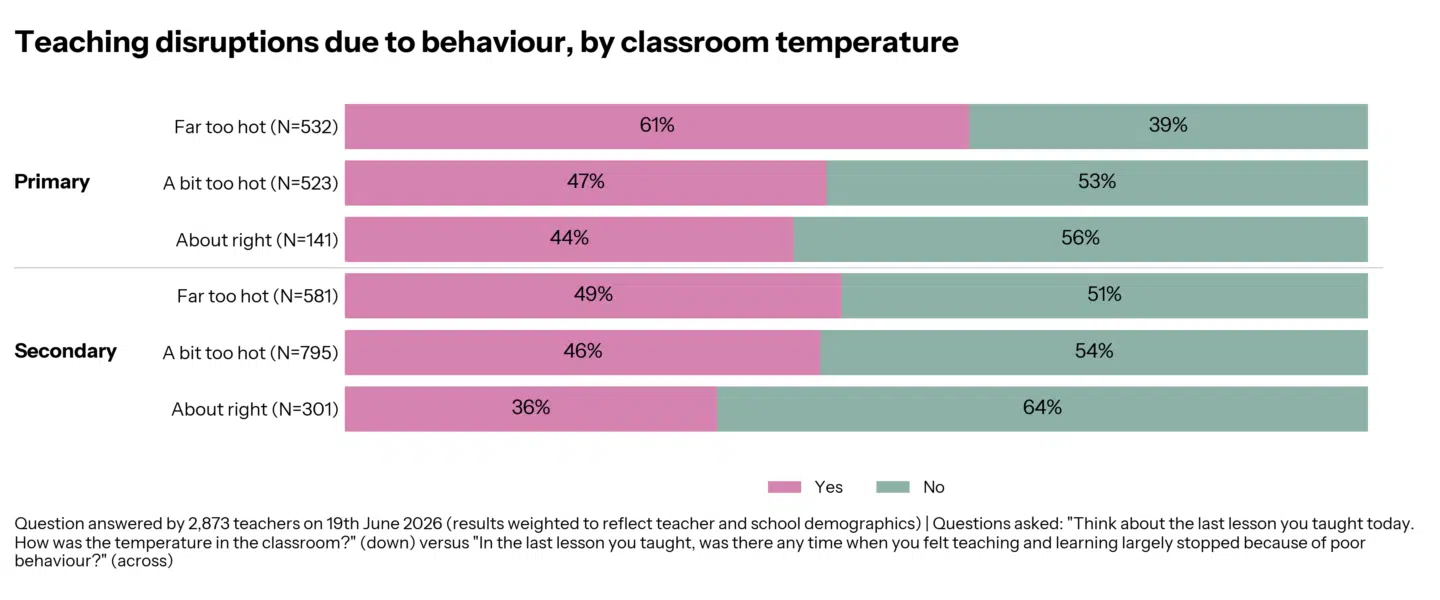
There were a very small number of teachers who reported their classroom was “too cold”; however, because this was such a small group, we had to exclude them from the results, as their sample size meant we couldn’t compare them to the other groups.
Could this be explained by teachers in classrooms who have classrooms that are too hot, and are the ones who experience poor behaviour anyway? Possibly – just because the teachers in hot classrooms reported more disruptions, that doesn’t mean the hot classroom was to blame!
We’ll be carrying on with our classroom temperature check with our future behaviour questions to keep an eye on the pattern…
Screen time in schools
Since the announcement of a social media ban for under-sixteens, screen time in school has also been raised as an issue, with the Government releasing a call for evidence on screen time in schools. But really, how much screen time are students getting? To find out, we began looking at the experiences of primary school students to capture how much screen time they have throughout the day.
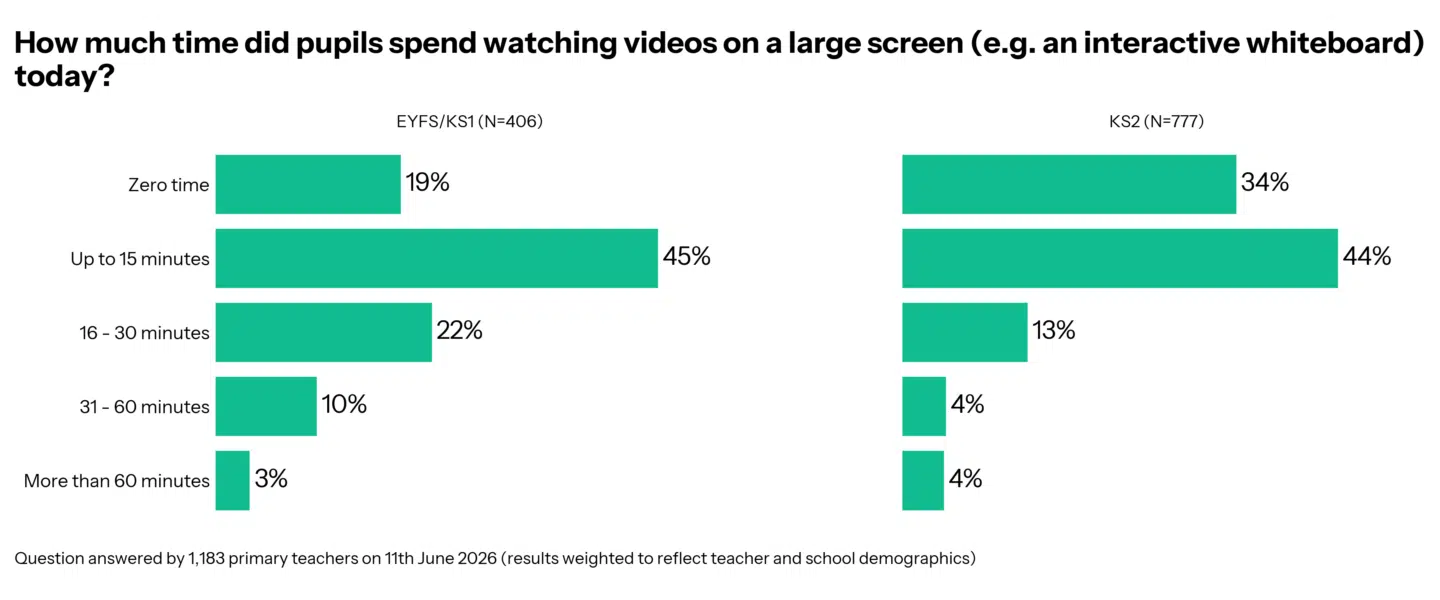
When it comes to the use of ‘large’ screens like interactive whiteboards, 19% of EYFS/KS1 teachers and 34% of KS2 teachers said they didn’t spend any time watching large screens, and there was a similar number of teachers in both phases reporting students watched large screens for up to 15 minutes (45% in EYFS/KS1 and 44% in KS2). A small number reported students watching screens for more than 60 minutes 3% in EYFS/KS1, and 4% in KS2.
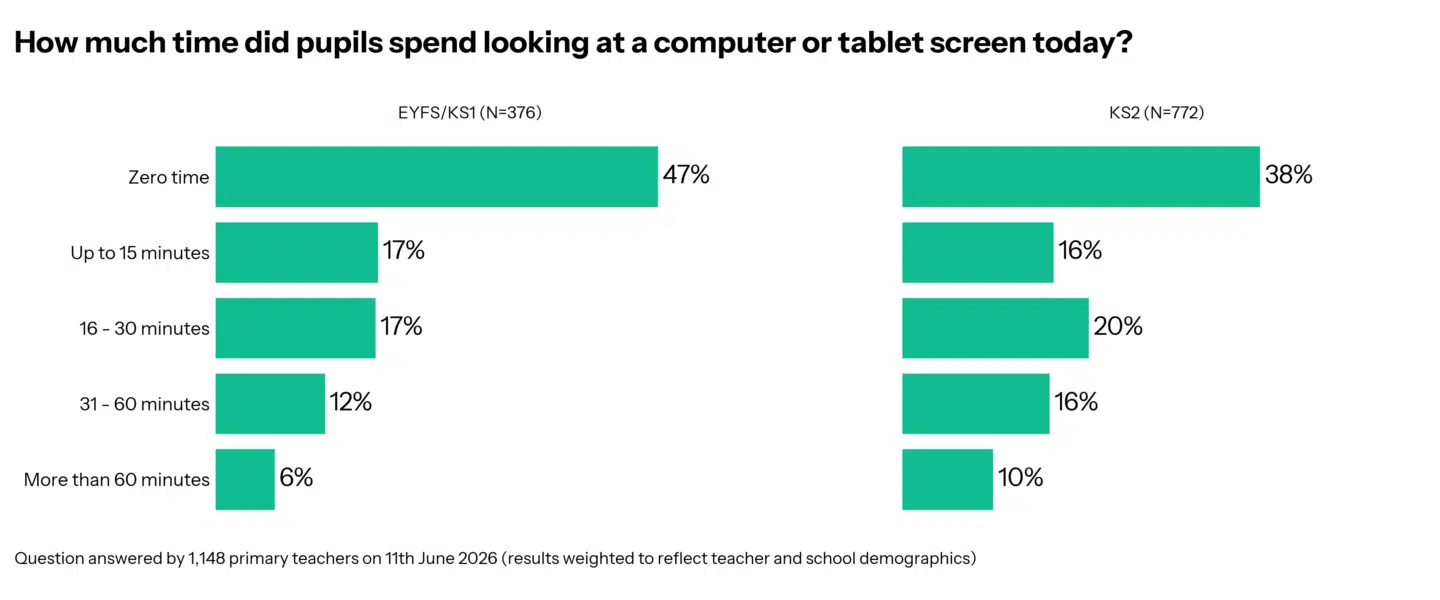
When it comes to smaller screens, more teachers reported zero time: 47% in EYFS and 38% in KS2. Of those using computers or tablets, use was quite spread out, with 17% and 16% reporting use up to 15 minutes, and 17% and 20% looking at computers or tablets for 16-30 minutes. A smaller percentage reported use going over an hour (6% in EYFS/KS1 and 10% in KS2).
If you’re interested in reading more about recommendations of screen time in schools, this report was published in 2024, and if you want to respond to the call for evidence, you can do that here.
Displays
A few weeks ago a Teacher Tapper wrote in to tell us her new school was going to review its display policy, and wanted to get a sense check of what other schools were doing. Fortunately, this is what Teacher Tapp is great at!
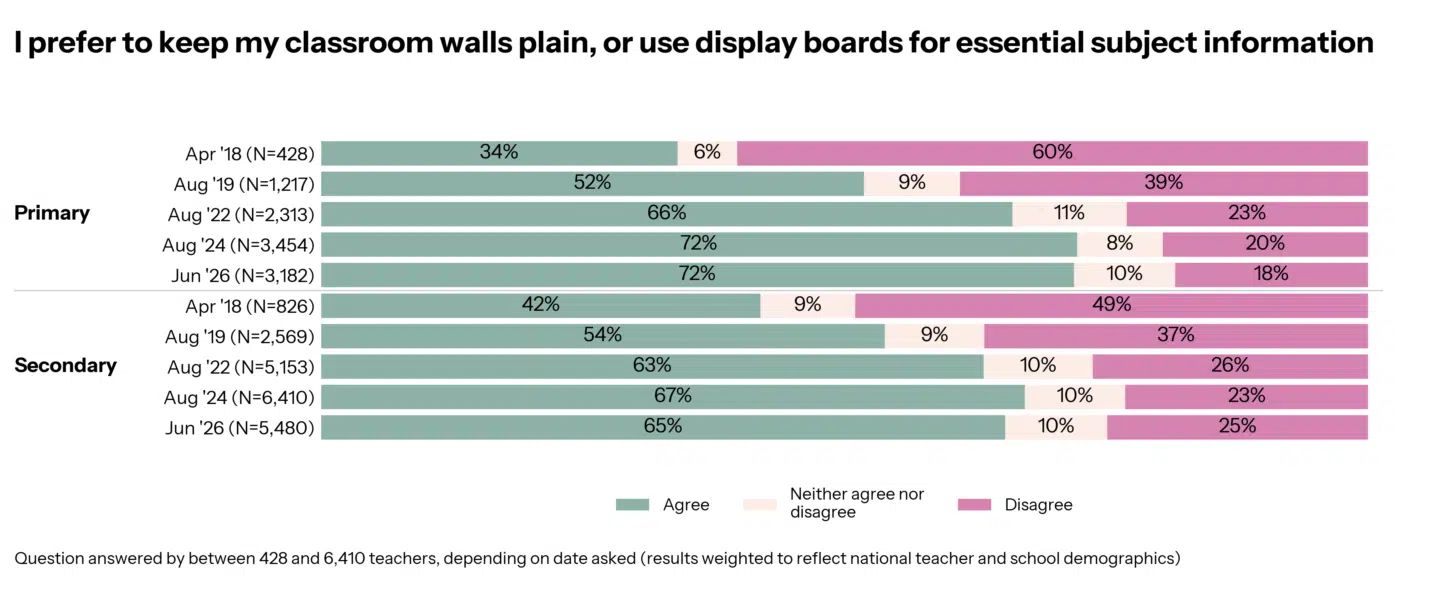
We found a shift in attitude towards displaying in schools compared to when we first asked in April 2018. In primary schools, just 34% of teachers agreed (strongly and slightly) that they preferred plain classroom walls, whereas today that figure has more than doubled to 72%. For secondary teachers the shift is less dramatic but in the same direction: 42% in 2018 UP to 65% in 2026.
Who is responsible for displays?
While the favour for plain classroom walls has increased, so has the number of teachers telling us they are solely responsible for displays.
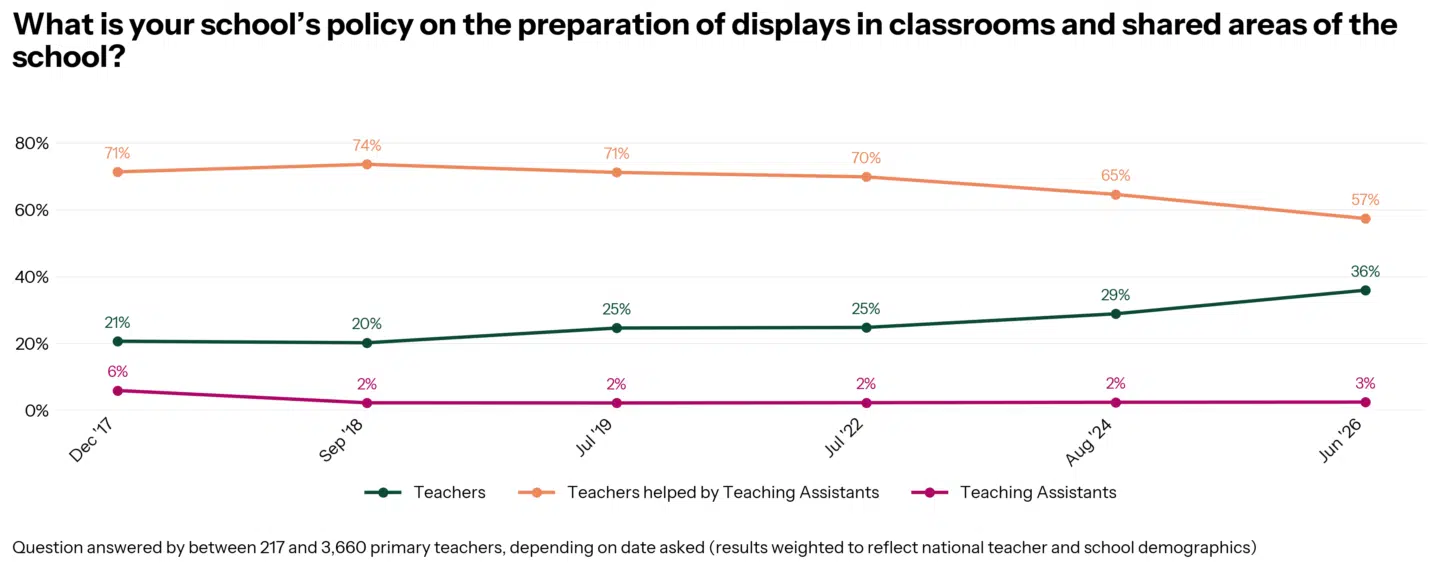
In primary schools, the number of teachers who say they are responsible for putting up displays along with the help of teaching assistants has fallen from 76% in its 2018 peak to 59% in 2026 – a drop of 17 percentage points. This has happened while at the same time the number of teachers who report being solely responsible for displays has grown. 21% of teachers told us they were solely responsible in 2017, and this grew to 36% in 2026.
It’s worth keeping in mind that in January 2024, a policy was brought in to limit the admin tasks teachers should be asked to do, and this included putting up displays.
In secondary schools, the figures haven’t changed in the same way: in 2017, 50% of teachers reported they were responsible for displays; in 2026, that number is 52%. The number of teachers reporting that teaching assistants helped with displays has dropped from 34% in 2017 to 24% in 2026. In 2017, just 8% said teaching assistants were solely responsible for displays, and today that figure is 5%.
These numbers can be explained by the lower number of support staff in schools, so when policies are introduced to cut workload, like displays, they struggle to have a meaningful impact unless there is a viable alternative option to pick up the work.
And finally, working walls! 5% of primary teachers and 35% of secondary teachers say they do NOT have a working wall in their classroom. Among those who DO have working walls, they seem pretty popular! 75% of primary teachers and 63% of secondary teachers say they aid learning.
When it comes to display policies, 10% of primary and 9% of secondary leaders reported having no policy in place. Among those WITH a policy, 73% of primary leaders say their policies include having working walls (in either every classroom or in certain key stages), but just 13% of secondary leaders said the same.
If you’re considering a change of policy for the new academic year and would like Teacher Tapp input, get in touch and we will see if we can help! England@teachertapp.co.uk 📧.
AI – paid or free?
Not all teachers use an AI tool for their school work: 7% of primary teachers and 6% of primary leaders, and 9% of secondary teachers and 5% of secondary leaders told us they hadn’t used an AI tool.
Among those who DID use an AI tool, 80% of teachers in primary school and 67% of leaders in primary school used a free version. The same was true for 78% of teachers in secondary school and 67% of leaders in secondary school.
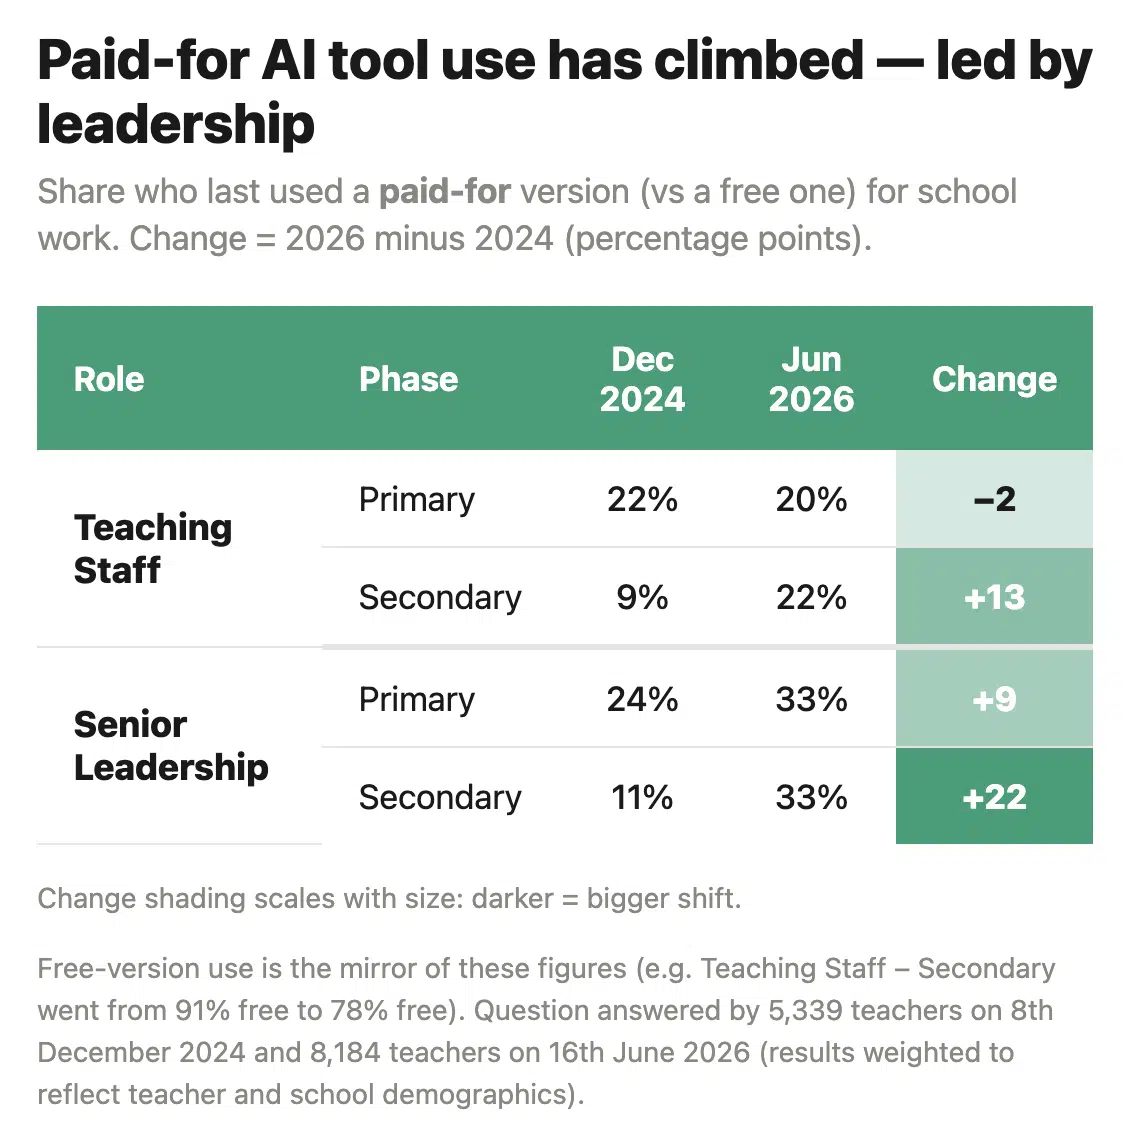
Compared to 18 months ago, there has been quite a shift! The number of primary teachers using paid AI tools hasn’t shifted much (20% in 2026 vs 22% in 2024). However, the number of secondary teachers telling us they used a paid app has increased (22% in 2026 vs 9% in 2024), and both the number of primary and secondary leaders using paid AI tools has increased (33% in 2026 vs 24% in 2024 for primary leaders; 33% in 2026 vs 11% in 2024 for secondary leaders).
Daily Reads
Is handwriting better than typing? That was the big question that this week’s top blog was trying to answer. It’s not too late to read it – check it out here.
There are so many great blogs out there and we love featuring them on Teacher Tapp. If you have a blog you think we should feature, then please email us at england@teachertapp.co.uk and we will check it out!