Congratulations, ECTs! For those of you who are ECT1, you are nearly halfway through. ECT2s, this is the beginning of your goodbye to the ECF, and soon you can call yourself a fully-fledged teacher!
We’ve been tracking your progress – and here are our some of the most interesting results…
1. ECTs wellbeing
Going into the ECT programme, any teacher will be aware that challenges and difficulties lie ahead. But how did our ECTs find the academic year? One way we track the wellbeing of teachers is to ask about levels of contentment. Using a 1 – 7 scale and looking at those who rate themselves 5 or higher, we find that actually, ECTs report higher levels of contentment than non-ECT classroom teachers. In September, the gap between ECTs and non-ECTs was 12 percentage points, but closed to 9 percentage points in November. It remained the same in January, but widened again in March to 12 percentage points, then grew to 14 percentage points in May before closing to 11 percentage points in June.
It’s important to note that these changes are mainly driven by non-ECTs experiencing lower levels of contentment in comparison to ECTs. And given the extra support supplied to ECTs, this makes sense: ECTs have a reduced teaching timetable, a mentor plus a support programme. Non-ECT classroom teachers wouldn’t have any of that extra help.
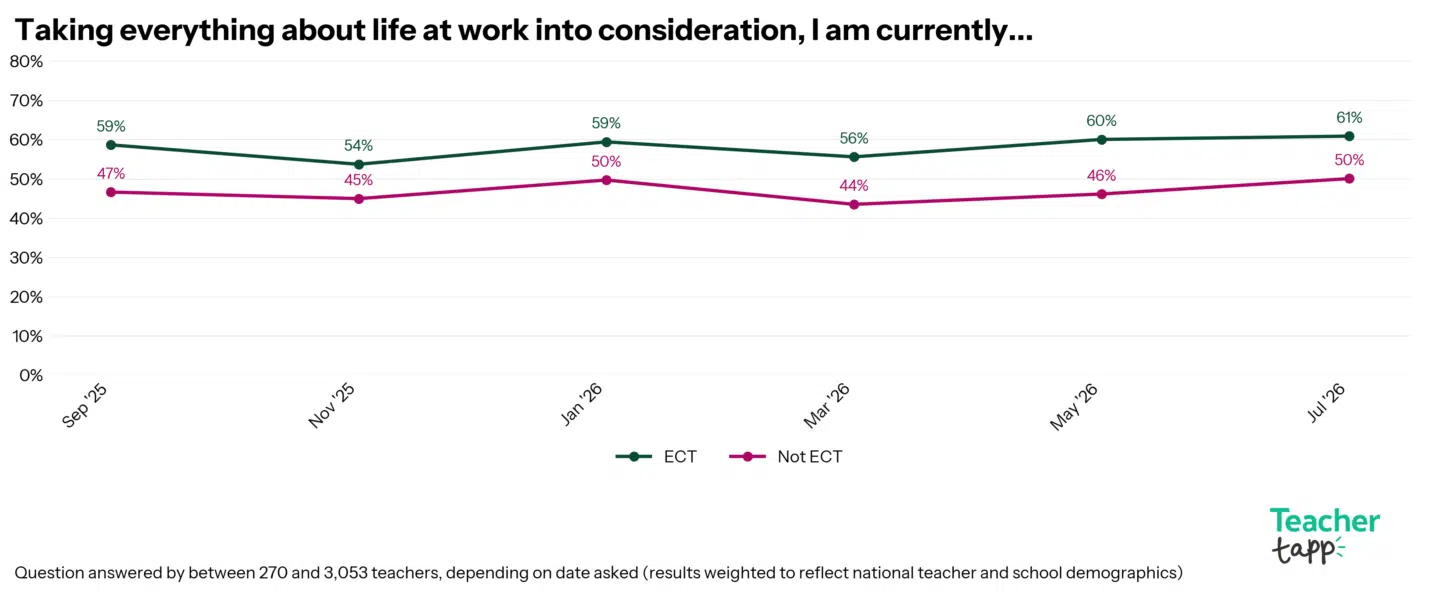
What can we take away from this chart? For starters, it’s the drop from September to November. ECTs clearly find this a more challenging time, and it’s useful for ECTs about to embark on their first year of teaching to keep that in mind, and for those who have been through the programme to reassure themselves if they found that period hard they certainly weren’t the only ones.
For those working in schools with ECTs, awareness that this point early on in the process can be really difficult can help get support when it’s needed. As we can see from the data, things do recover after the dip in November, and an early struggle to cope with the workload isn’t necessarily an indication that teaching isn’t the profession for them, but rather it’s a typical point in the academic year when new teachers often feel overwhelmed.
2. Expectation vs Reality
So if forewarned is forearmed, how do the expectations of ECTs match up with their reality? At the start of the year we asked ECTs what they anticipated would be the most challenging part of teaching, and then at the end of the year we asked what had been the biggest challenge.
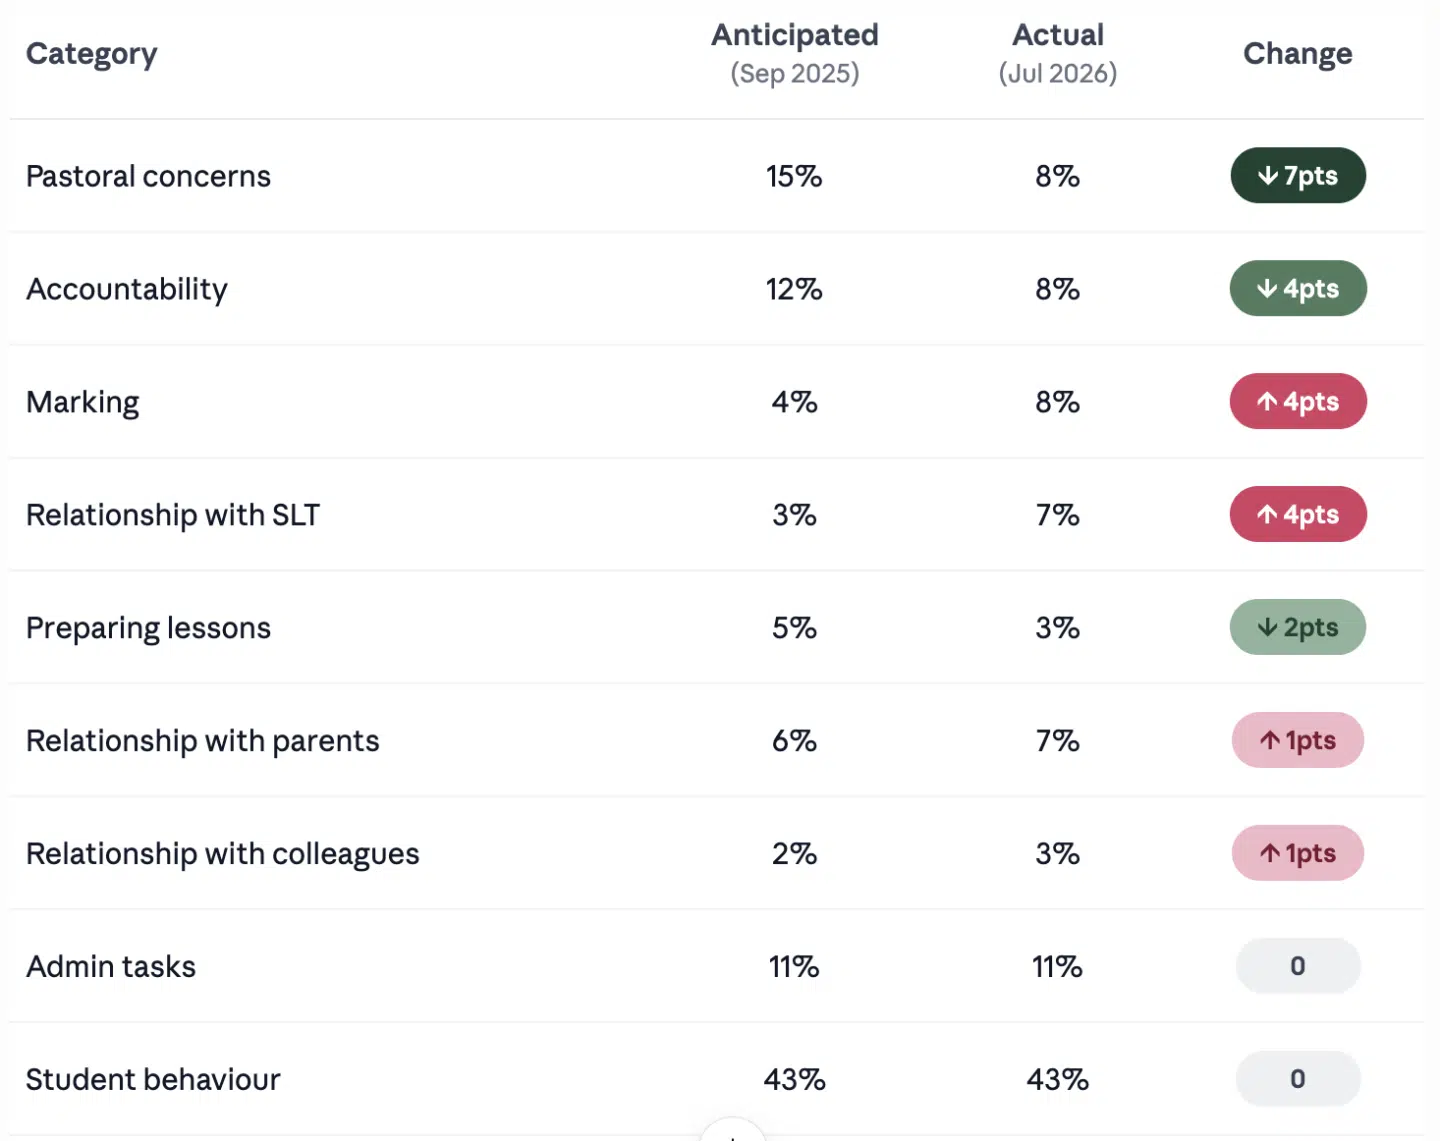
For the main part, expectations met reality: behaviour, admin, relationships with colleagues, relationships with parents, and preparing for lessons largely matched with their September predictions.
However, good news, pastoral concerns were much less likely to have been a concern: 15% predicted, but only 8% reported it had been the biggest challenge. Accountability was also a worry that didn’t come true for many, with 12% predicting, but only 9% reporting it as a main concern.
Marking was under-predicted (4% vs 8%) as was relationships with SLT (3% vs 7%) but these shifts are relatively small, and generally it paints a picture of professionals well aware of the challenges of the classroom.
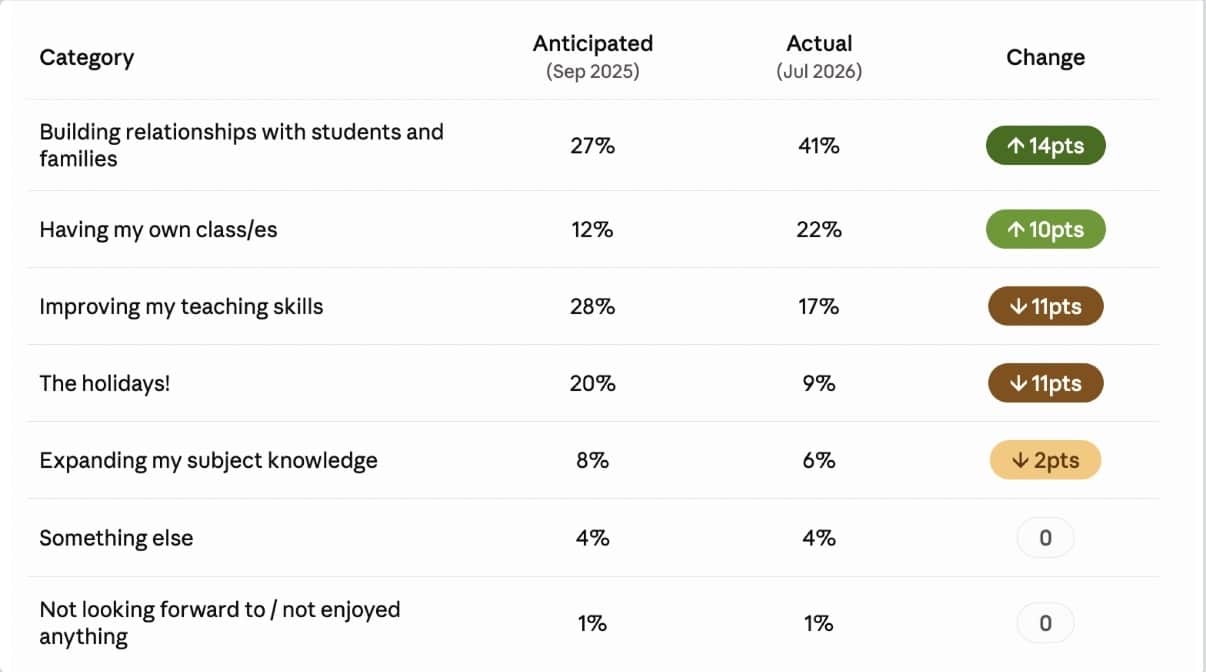
What other changes happened over the course of the year? Another expectation vs reality moment could be found when we compared the answers to two questions: “What are you most looking forward to this year?” Vs “What have you enjoyed the most this year?”.
In September, building relationships with students and improving teaching skills came out as the joint top answers (27% and 28%), but when we compare that to the reality, the clear winner was relationships, with 41% of ECTs telling us that was the best thing about their year.
And holidays proved to be less of a draw than expected: 20% of teachers thought they would be the best thing about their year, but in reality, this was true for only 9%.
3. Behaviour ECTs
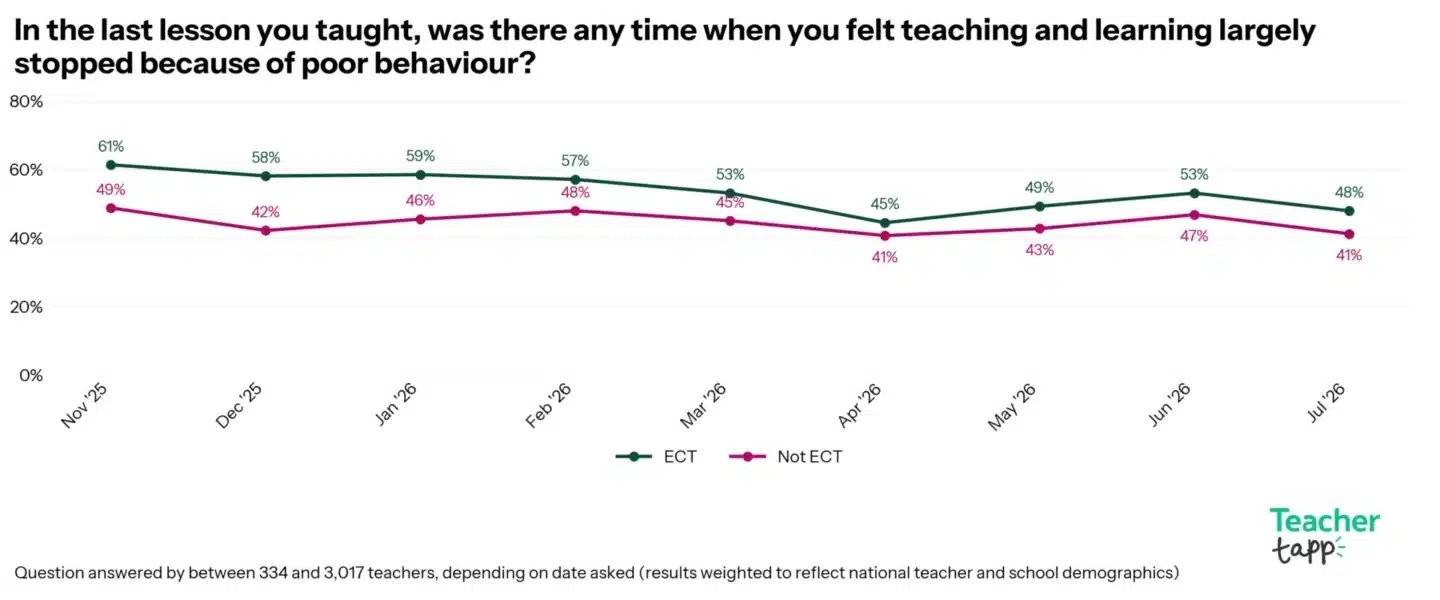
If behaviour was the biggest concern for ECTs before they started and proved to be the biggest challenge they faced, it’s only fair to give this data a really deep dive. So let’s start with how frequently ECTs saw behaviour stop learning in their classroom.
There is a wide 16-point gap at the start of the year, where far more ECTs had disrupted lessons compared to non-ECT classroom teachers (58% vs 42% in December), but over the year it slowly closed to just 4 percentage points in April (45% vs 41%). However, May saw an increase in disruptive behaviour, and a widening of the gap (49% vs 43%), and June behaviour deteriorated again (53% vs 47%), both with gaps of 6 percentage points. The not-too-disheartening news! The gap this time has remained steady AND (definitely good news) there has been a drop in poor behaviour (48% vs 41%, 7 percentage points).
What does this mean? One interpretation could be that at the start of the ECT, behaviour is much trickier for ECTs when compared to more experienced non-ECT classroom teachers – but things get better quickly. But as the academic year progresses, challenge increases and requires a different set of behaviour management skills: working with students in hot classrooms, or individuals finding exam pressure tough, or motivating unmotivated learners are very different in the summer term compared to the Spring and Autumn.
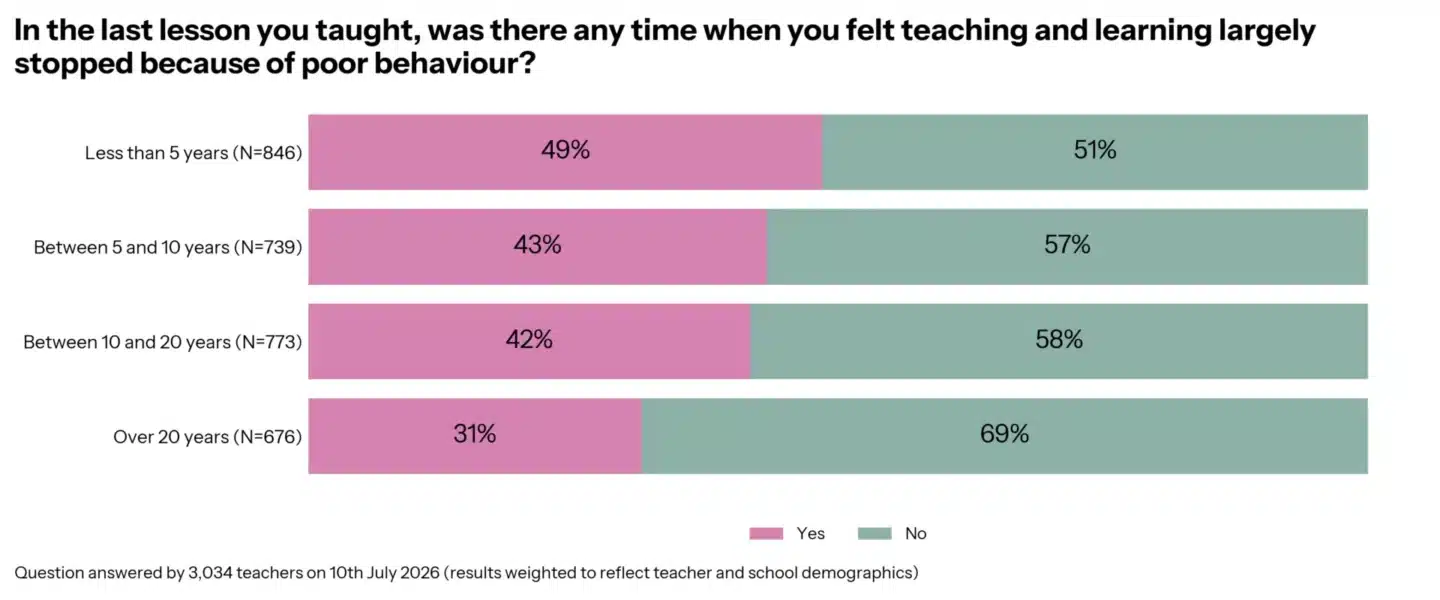
But if there is a 7-percentage-point gap between ECTs and non-ECT classroom teachers in July, what does it look like for teachers with more experience? You probably won’t be shocked to learn the longer you have been in the classroom, the less disruption you face. And things really start to get better when you have been teaching for more than five years. In July, 43% of classroom teachers with 5 – 10 years of experience reported disruptions, dropping to 42% for those with 10 – 20 years of experience, and then just 31% for those with 20 + years. So the good news is, things do get better the longer you do them!
4. Behaviour as a cause of stress
If behaviour has been the biggest concern for ECTs, AND they see more disruption compared to non-ECT classroom teachers – what impact does that have on ECT’s stress levels?
At the start of the year, ECTs are more likely than non-ECT classroom teachers to report that behaviour caused them stress or unhappiness, but as the year progresses, that gap shrinks. In October, there is a 14 percentage point gap (67% vs 53%), but this falls to 10 percentage points in February, then 9 percentage points in March and April, widening slightly to 10 percentage points in May before halving in June to 5 percentage points.
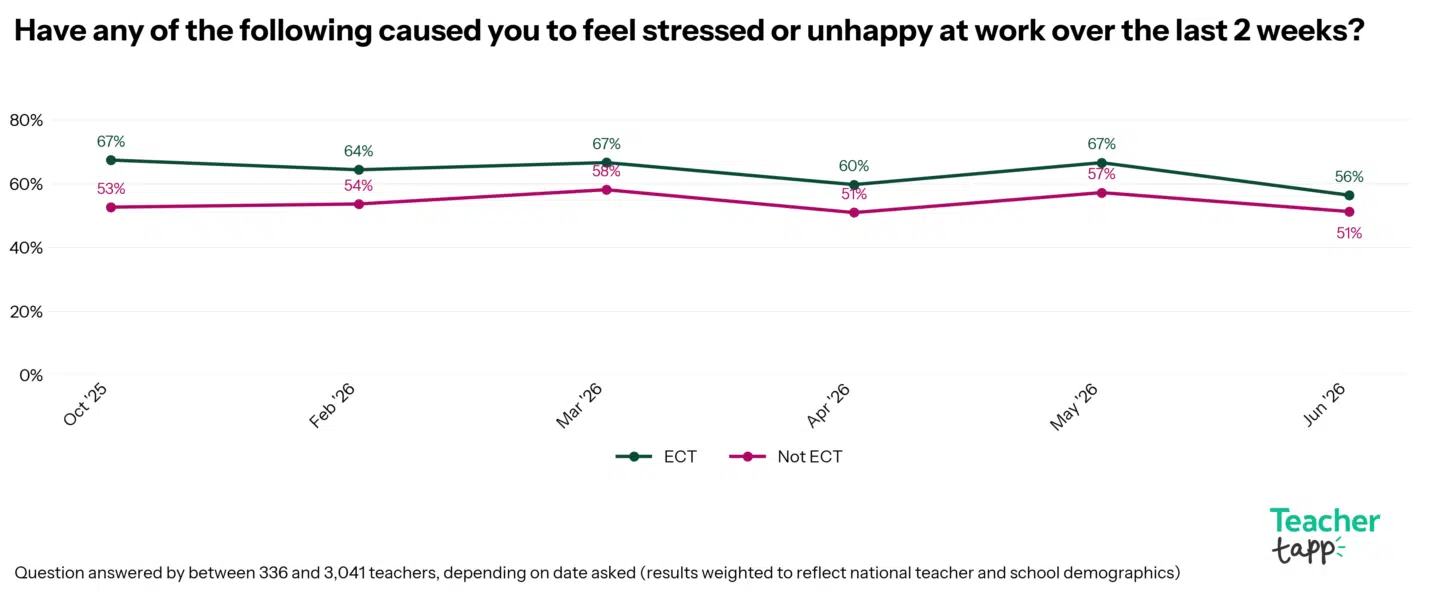
It might be a common refrain in teaching to say: keep going, it does get better! But here, again, the numbers really do back this up, and should hopefully give ECTs the reassurance that no matter how bad it feels at the start, by the end of the year things will settle down.
5. AI use
Touted by some to be the time-saving, job-changing, classroom-revolutionising tool of the future, use of AI is something that here at Tapp we have been tracking for a while.
We do know ECTs are more likely to report they have used AI to plan their lessons when we ask each term (when we checked in July, ECTs were 15% more likely to say they used AI to plan their last lesson). But how does use of AI differ between ECT and non-ECT classroom teachers?
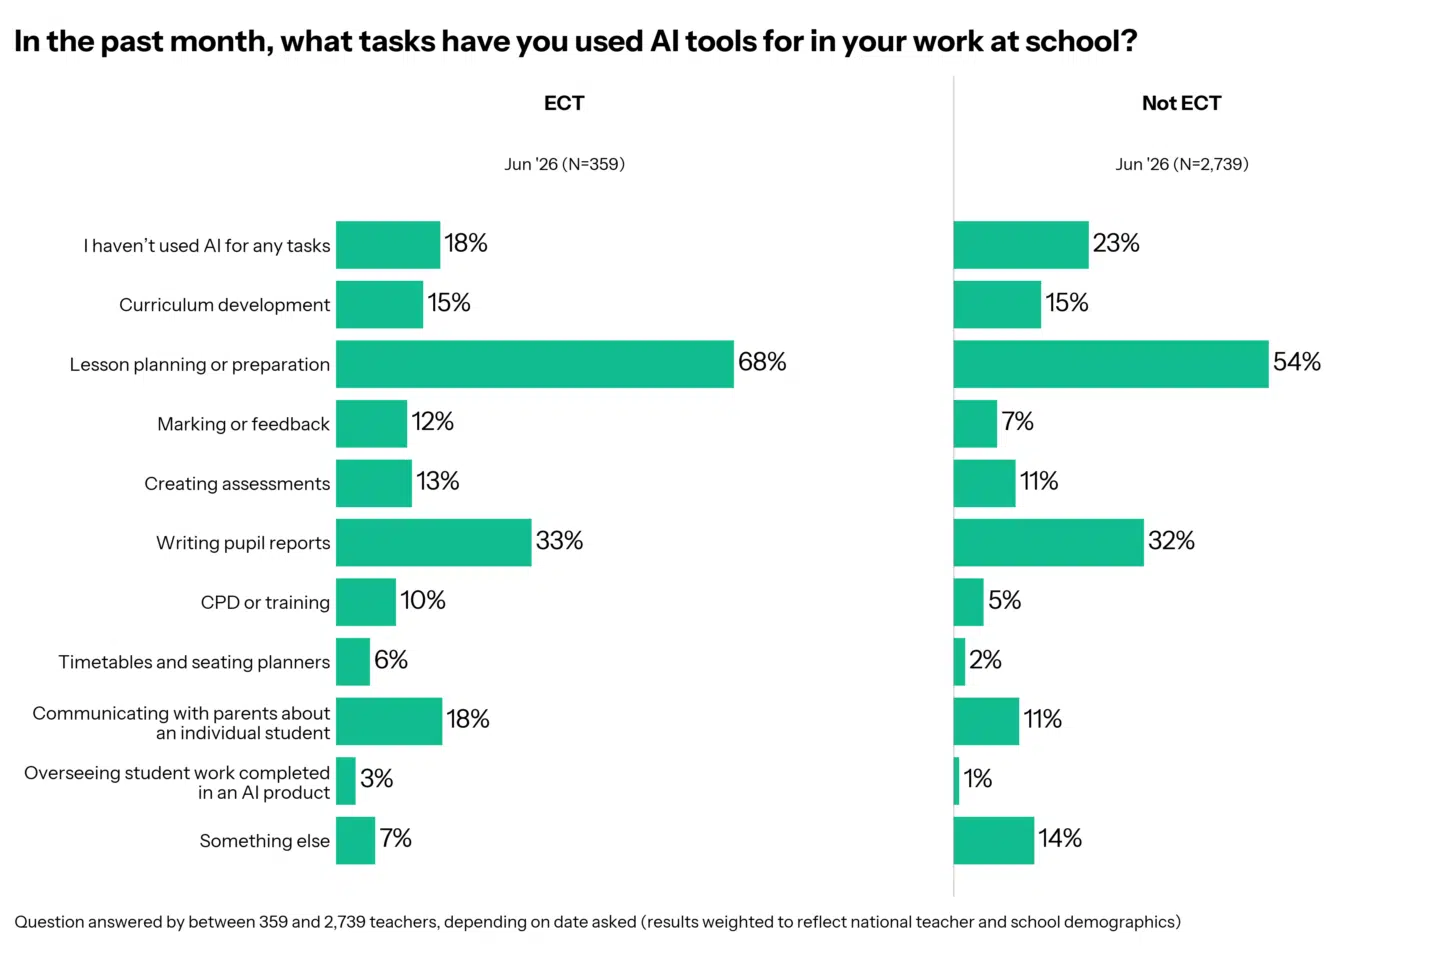
ECTs use AI more across nearly every task. Biggest gaps: lesson planning (68% vs 54%), CPD or training (10% vs 5%, double), timetables/seating planners (6% vs 2%, triple), communicating with parents (18% vs 11%), and marking or feedback (12% vs 7%).
ECTs are also less likely to say they haven’t used AI at all (18% vs 23%).
Curriculum development and writing pupil reports are essentially flat between the two groups (15%/15% and 33%/32%).
Onto next year…
And now onto a new year! We have lots of ECT questions to finish off the year, so keep an eye out for them in your app so if you are going onto year two, keep an eye out for them in the app, and if you know any ECTs, please do use your refer button and tell more teachers about our great insights. If you have any contributions you would like to share, please do send them in! 📧 England@teachertapp.co.uk
Have you got ECTs at your school who you think would find these findings interesting? Maybe they would like to take part in our investigation into the ECT experience! Use your app to send a referral, and get them Tapping!