Hey there, Tappsters!
The end of Autumn term one is coming to an end! Well done, Tappers! We know this term is tough, but you’ve nearly completed it and the break is nearly here…
New prize draw!
Happy October! We have a new ‘thank you’ for Teacher Tappers.
Between Tuesday 7th October and 31st October, for every TEN questions answered Tappers will be awarded a ticket in the prize draw. On the 1st of November, TEN Teacher Tappers will be drawn and be sent £100 gift cards.
To be in with a chance to win, all you have to do is tapp! Good luck!
The rise and rise of AI
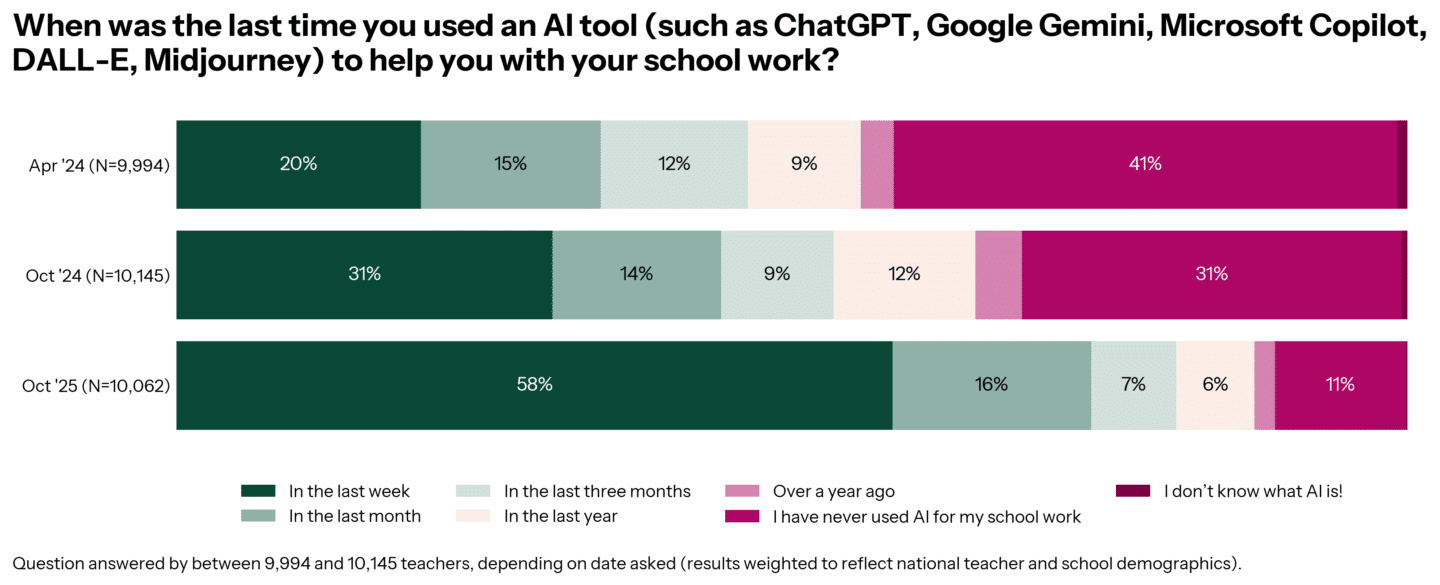
This week, the number of teachers who say they used AI for their work tipped over the line into ‘majority’ territory, with 58% reporting they used an AI tool to help them with their school work.
This time last year, that figure was just 31%, indicating a sure move towards an AI-integrated workplace. Those teachers who have NEVER used AI for their work are becoming a smaller and smaller group. Last year, it made up 31% of the teachers; this year, that figure has MORE THAN HALVED at just 11%.
Teachers reporting they used AI in the last week has increased across ALL subjects and phases, but the biggest increase has been among humanities teachers who have jumped UP 33 percentage points from 30% to 63%. Teachers of PE and other subjects are the biggest users of AI at 70% – this is likely to be explained by the fact that teachers of computing are included in this group.
- EYFS/KS1 19% to 48%
- KS2 36% to 64%
- English 36% to 66%
- Maths 19% to 42%
- Science 29% to 53%
- Humanities 30% to 63% (⬆️ the biggest increase)
- Languages 27% to 53%
- Arts including D&T 30% to 58%
- Other including PE 43% to 70%
- Special/AP 27% to 59%
What does this mean for schools? Well use of AI doesn’t necessarily mean GOOD use of AI – are staff sharing their tips for prompts or how they effectively use AI – or is there a reluctance to speak about it?
Teachers might not be sharing their tips in AI due to a lack of clear policy around use of AI tools at work – for example when we asked in June, 53% had no clear policy for using AI to write reports!
Look out for more questions on AI – we will be trying to find those insights that can help teachers work out what IS working when it comes to cutting workload and improving teaching.
Online homework
From teachers on screens to students on screen – how much homework is being completed online?
About half (57%) of homework set requires students to use the internet, and although KS2 and secondary are more likely to set tasks that require students to go online, 25% of EYFS/KS1 teachers answered ‘yes’, too.
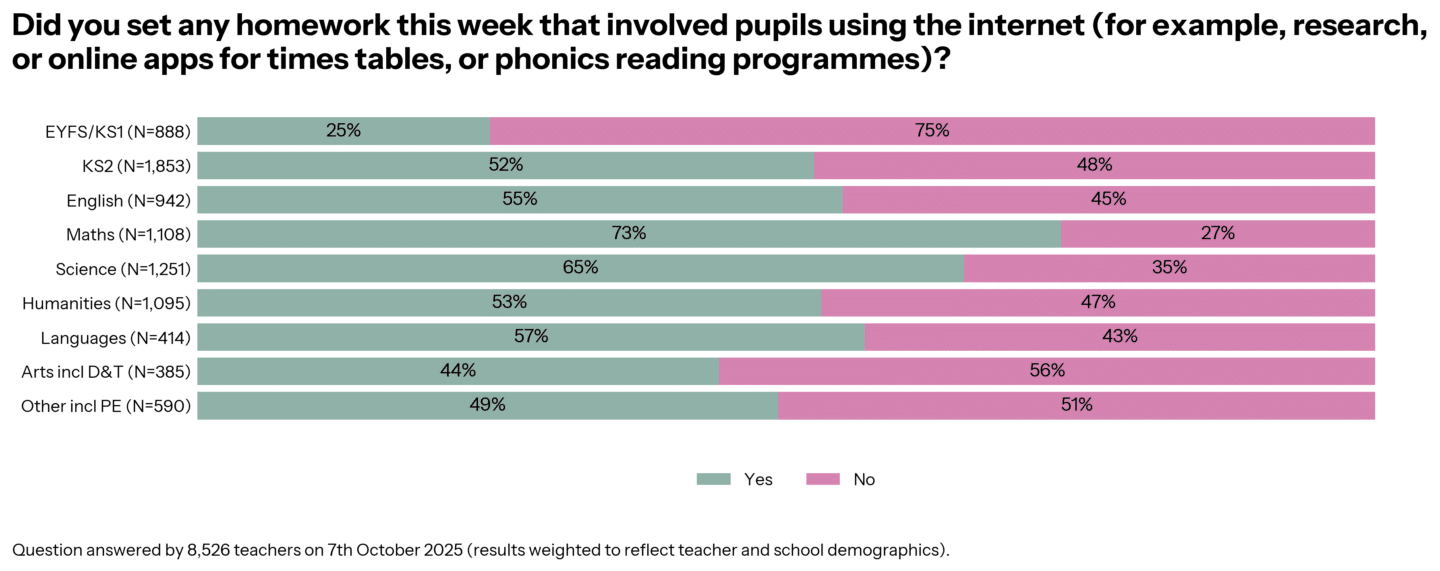
With so much work requiring an internet connection, are schools routinely checking with parents that there is an internet connection at home and access to devices? There are widespread reports on the issue of digital poverty and a growing movement against children using screens (for example, smartphone-free childhood). Might this become another point of contention between home and school in the future?
Top of the stress chart
Have you ever answered a Teacher Tapp question and thought, hang on… haven’t I seen this before? You probably have — and there is a good reason why we ask some questions more than once!
Each month, we repeat certain questions, and plenty more come back termly or yearly. These repeats are especially useful because they help us see how teaching is changing over time. People often say things like, “Behaviour is worse than it was 10 years ago,” or “Teacher morale has never been lower” — but how can we tell if that’s really true? By asking the same questions again and again, we can track what’s changing and what’s not.
One of those repeat questions appeared last week — this time, all about what’s causing teacher stress!
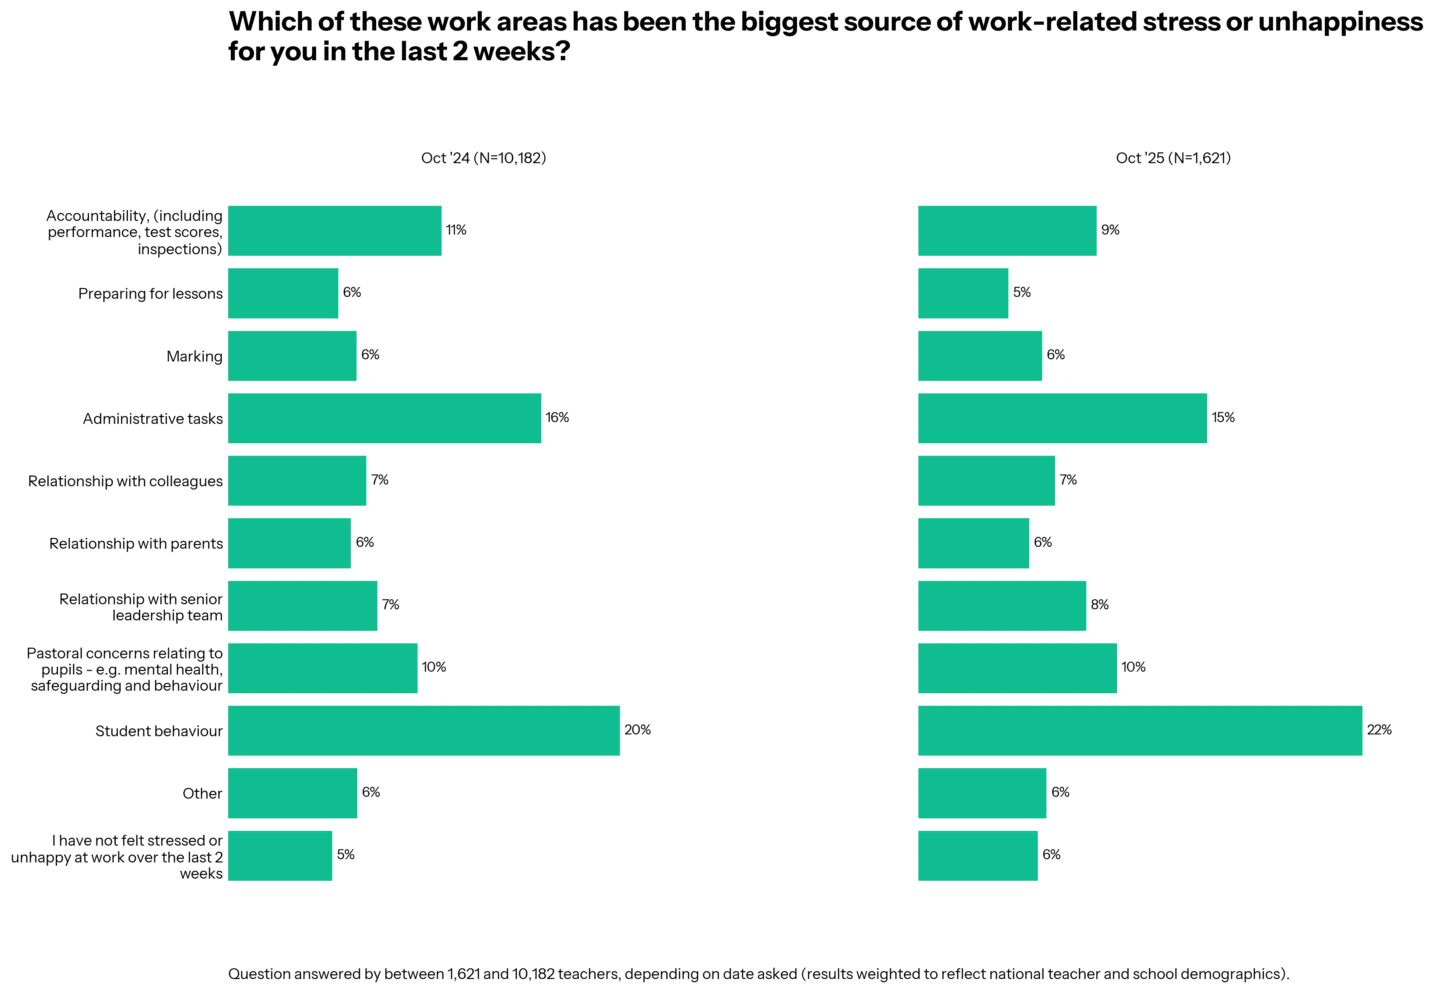
Compared to last year, the number of teachers stressed about accountability has dropped a little from 11% to 9% but everything else has remained the same.
So if you are feeling frazzled by some aspect of your work, then fret not that this is a YOU problem – 94% of teachers reported something was stressing them out or causing unhappiness in the last fortnight.
Behaviour tracker
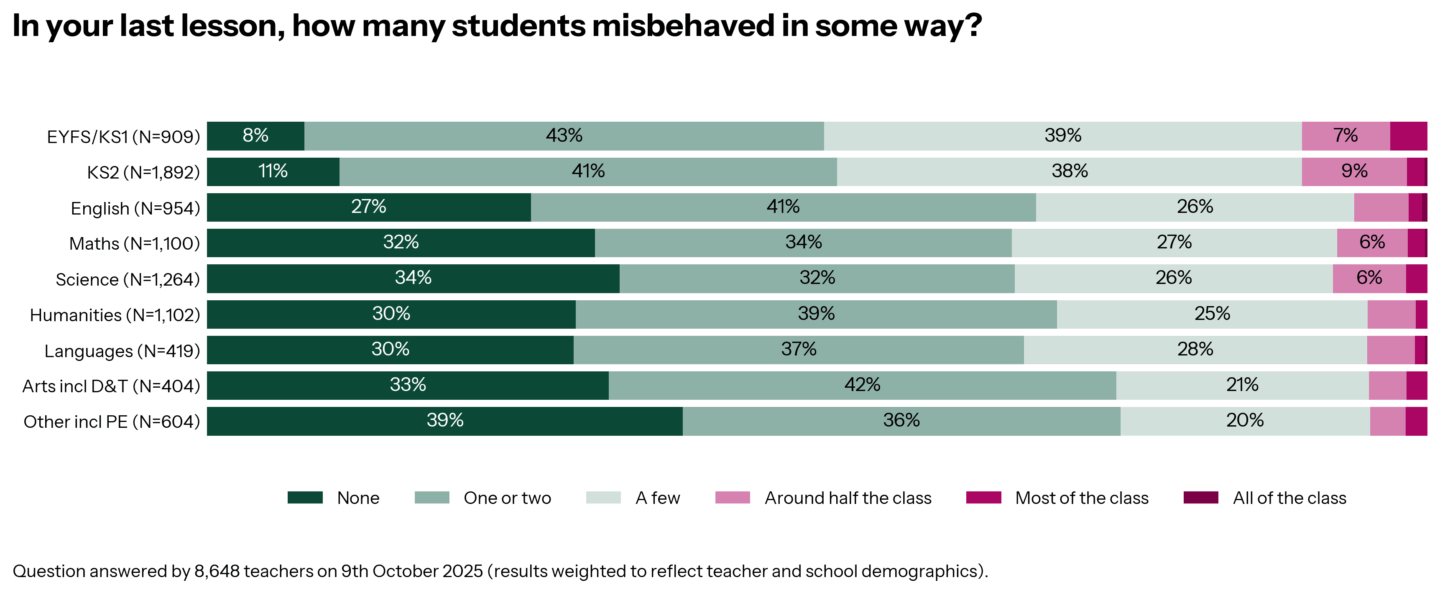
The break for half term is approaching – but how is behaviour looking?
Primary teachers report the highest number of misbehaving students, with EYFS/KS1 reporting 92% of lessons had misbehaving pupils, and 81% of KS2 students misbehaved.
Over in secondary, other including PE had the LOWEST number of teachers reporting misbehaving students (61%) and English had the most (73%).
The overall percentage of teachers reporting “none” of their class misbehaved has remained broadly the same as last year (23% in 2025 and 24% in 2024).
Other behaviour news…
FEWER teachers report their school have an ‘easy to read’ version of their behaviour policy compared to 2022 (49% vs 59%).
FEWER teachers say their school displays their behaviour policy around the schools compared to 2022 (42% from 50%).
But – the number of teachers who say they overlook behaviour issues “every” or “most” lessons has remained broadly the same compared to last year (28% vs 30%).
+ BONUS representative subject splits in SLT
A common question request from secondary Teacher Tappers is about the subject specialisms of senior leaders and headteachers.
Although we know current subject and seniority of Teacher Tappers, often the subject a teacher is trained in, and the one they end up teaching when on the senior leadership team, don’t always say the same. Therefore this required a new question to work out if there was overrepresentation on senior leadership teams.
The results are in! A tie at the top with 19% of senior leaders were originally trained in English, and 19% in the humanities. 16% were trained in science, 13% maths and 10% PE.
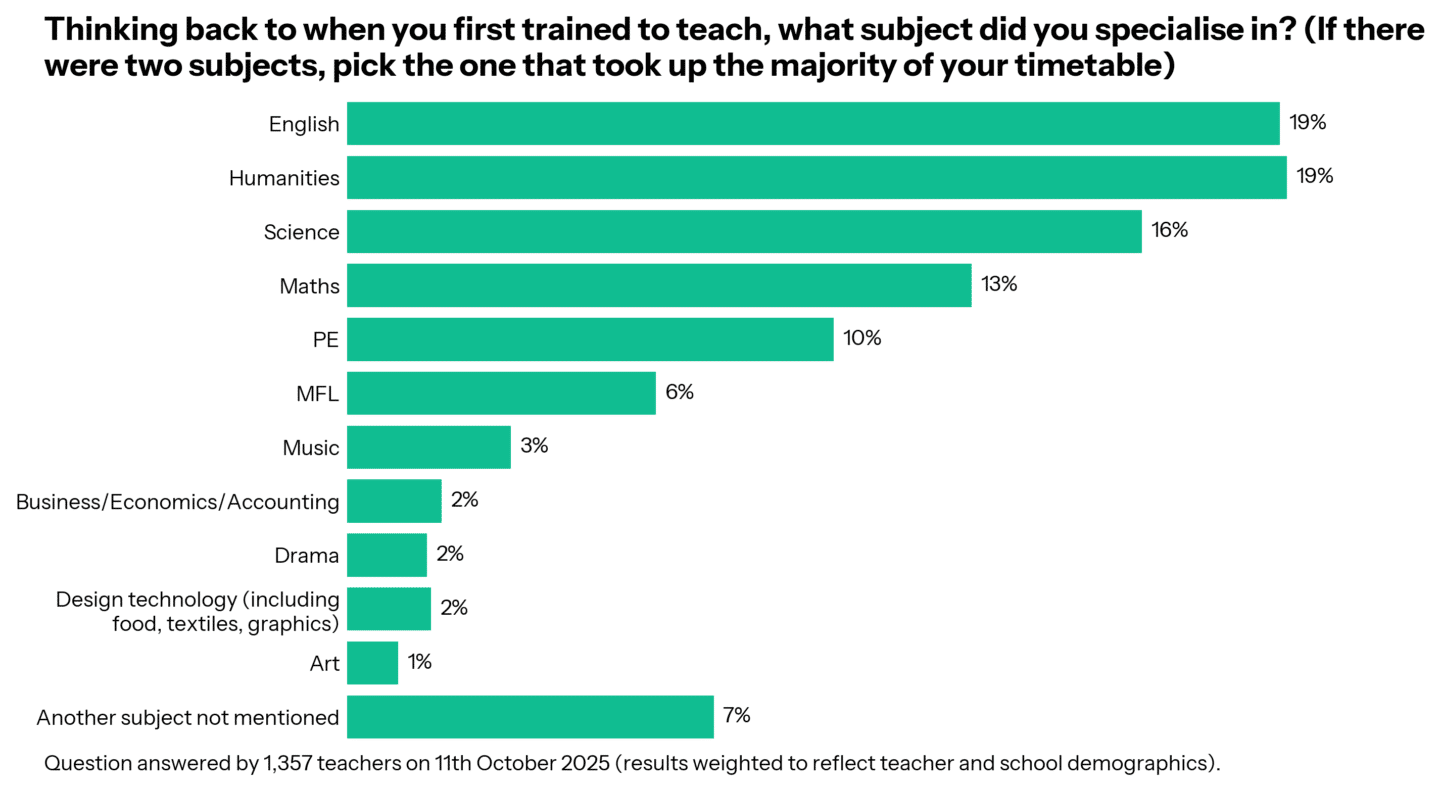
Is this a representative split of teachers in senior leadership? 🤔 It’s a tricky one to answer — but one way to get a rough idea is by looking at how many hours each subject is taught. Department for Education workforce census data shows that science, maths, and English take up the most teaching hours, followed by PE and sport. So if you’ve ever wondered whether PE teachers are overrepresented in your SLT, remember: there are simply a lot of PE teachers in schools! Maybe not so “overrepresented” after all.
If you have a question you would like to ask, then drop us a message and let us know! england@teachertapp.co.uk.
Daily Reads
Rachel Johnson’s blog on running better meetings came top of the charts this week! 11% of school leaders read the blog, and 8% of classroom teachers read it this week!
Got a blog you think we should feature? Email us at england@teachertapp.co.uk and we will check it out!