December has landed! Yes, this is the month when students in your class have had chocolate before breakfast, and your to-do list starts to spiral out of control. No wonder most teachers pick December as the toughest month (29% of you!) but, teachers, we believe you have got this! Stay strong!
Win an iPad!
Last month over 50 Teacher Tappers were sent thank you boxes crammed with Teacher Tapp goodies – here at Tapp Towers, we have loved watching the videos and seeing the photos of you opening them – please do keep sending them in!
Now, the elves have dropped by with the gift for December – and we have an iPad for ONE lucky Tapper to win! All you have to do is tapp, and every ten questions gets you ONE ticket in the draw. We will pick the winner on the 18th of December, so keep an eye on your emails, and you can watch your tickets grow in the app! Check the Ts and Cs here.
AI on the up
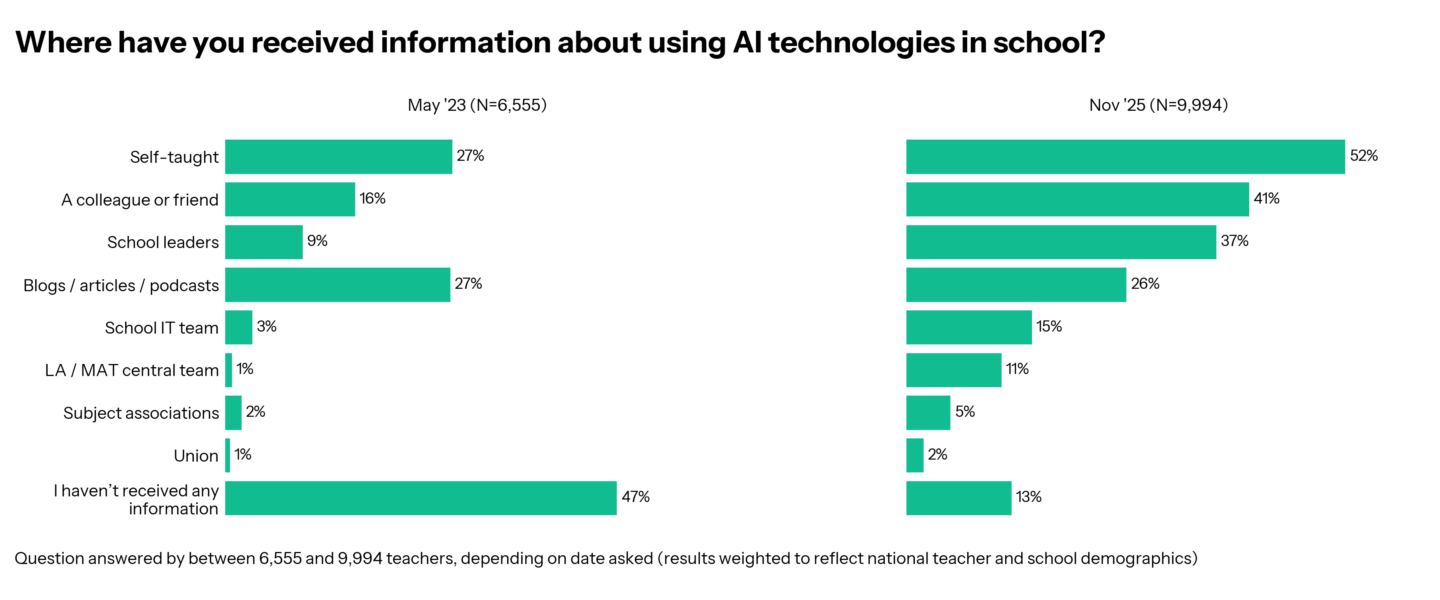
It feels as if attitudes to AI have changed just since the start of the school year, so looking back to 2023 is akin to stepping into a time machine.
And what does the time machine tell us? First off, there are huge changes in where teachers are getting info on AI from, and the biggest change has been the 34 percentage point drop in those who have had no information on AI (13% DOWN from 47%). So where is this information coming from?
1. Self-taught: 27% in 2023 now UP → 52%
+25 percentage points means that what was joint number one in 2023 is now the main source for AI information for teachers.
2. A colleague or friend: 16% in 2023 now UP → 41%
+25 percentage points suggests there is even more peer-to-peer sharing happening in schools, and it is the second most common source of information about AI.
3. School leaders: 9% in 2023 now UP → 37%
+28 percentage points points to a shift in attitude towards AI. This isn’t something happening on the peripheries, but is now moving into the school CPD calendar.
With all this AI learning, what are teachers doing with it?
There are, of course, a group who aren’t using AI. Across all subjects, 12% of teachers haven’t used AI for school work – but this jumps UP to 28% among special/AP teachers, and drops DOWN to 8% among KS2 teachers.
AI is being used for a variety of things, but the most common applications for teaching are:
- Lesson planning (57% primary vs 45% secondary).
- Making AI images (51% primary vs 36% secondary).
- Creating quizzes (34% primary vs 59% secondary).
But it’s not just pedagogy and planning – admin is also getting the AI treatment:
- Wrote letters home (42% primary and 34% secondary).
- Wrote reports (51% primary and 22% secondary).
Some of the eagle eyed among you wrote in to tell us the question about AI concerns was missing ‘environmental factors’. Thanks so much – this feedback helps us write better questions! We will ask again soon with a revised version of the question.
Mobile phones
Now from new tech problems to old ones: mobile phones interrupting lessons.
Not only do we ask Tappers about whether phones have disturbed their lessons, but we also ask about phone rules in their schools. This allows us to do some extra analysis and examine the data in more detail.
This week, 24% of teachers in secondary schools where mobile phones are allowed at break and lunch reported that a mobile phone came out in their last lesson, whereas this was true for just 2% of teachers in schools where phones are collected in or placed in pouches.
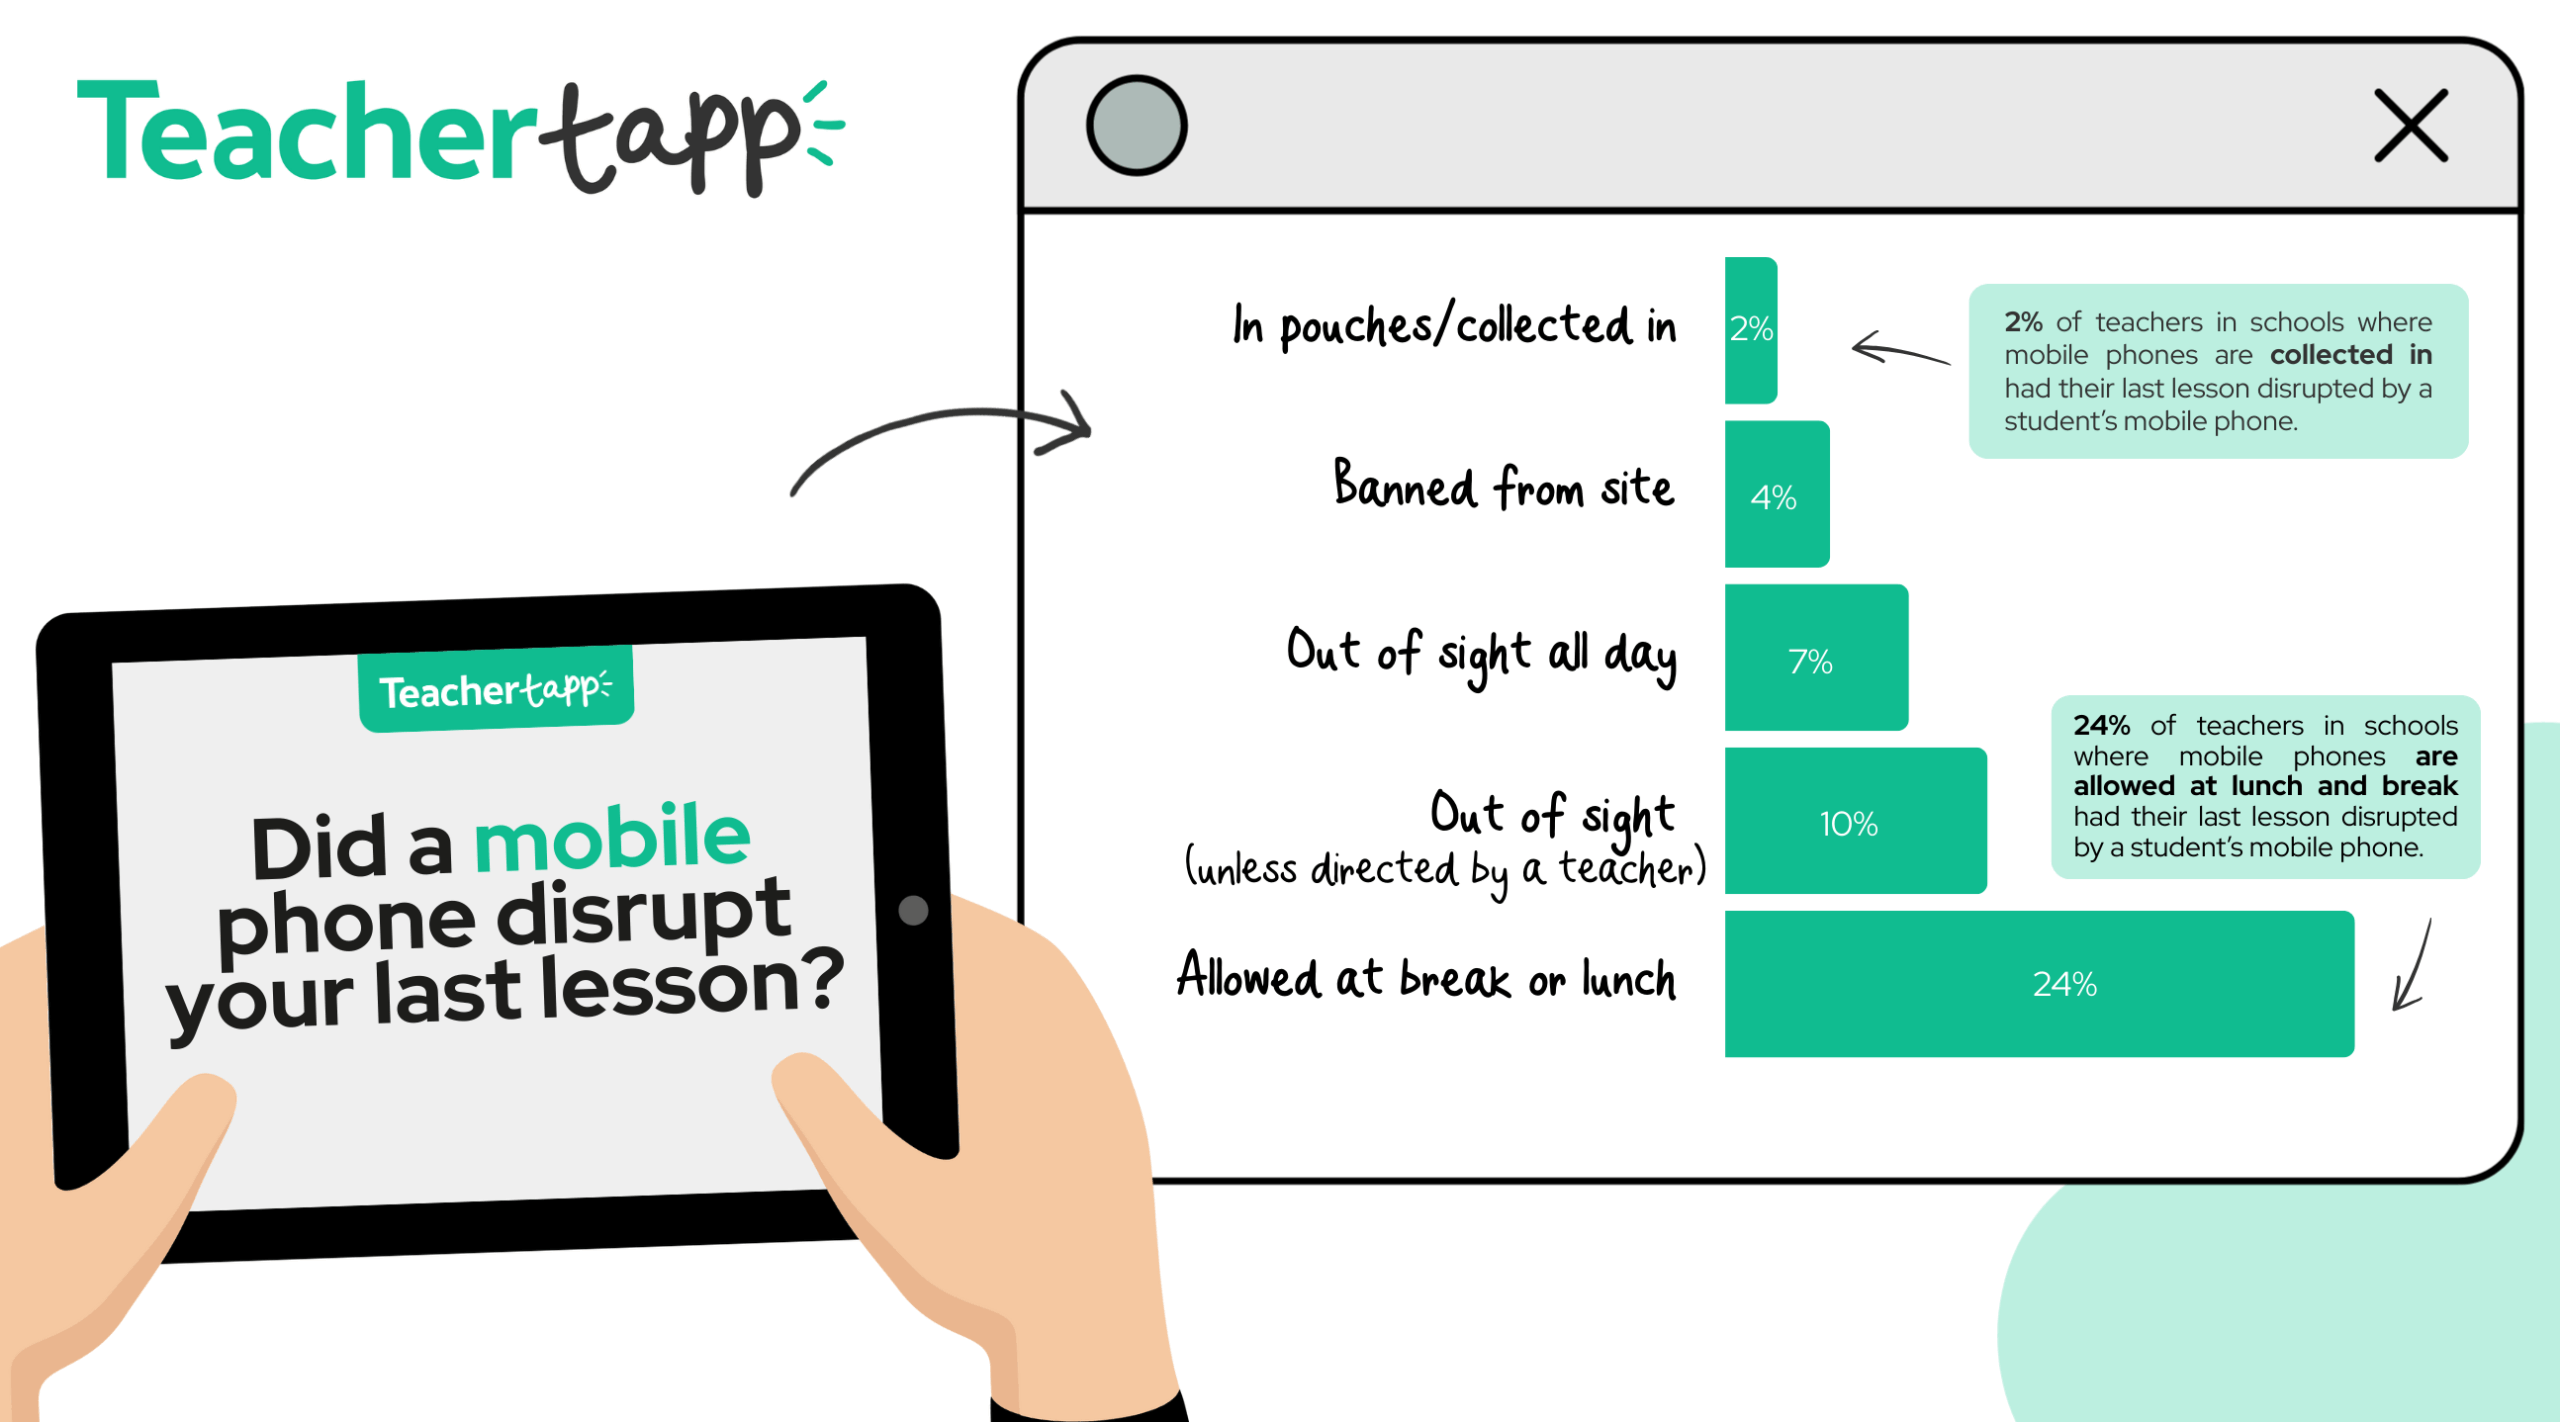
The good news is that disruptive mobile phone use in secondary appears to be on the decline – this week, 9% of teachers reported mobile phones in their last lessons, DOWN from 12% in 2023. And over in primary, it remains at a steady 0%. Phew!
More good news – this trend can be seen in both private and state schools: 6% of private school teachers reported interruptions in 2023, now DOWN to 3% ; 13% of state school teachers reported mobile interruptions in 2023, now DOWN to 9%.
The battle against mobile phones appears to be on the side of the teachers at the moment – and this might be attributed to the increase in schools tightening up their mobile phone rules – you can read more about this in our mobile phone blog from earlier this year here.
Lunchtimes
It’s the part of the day where there is no objective, no lesson plan and no learning outcomes – but that doesn’t mean it isn’t important.
Taking away a student’s break or lunch is one way of sanctioning behaviour – but how many teachers are allowed to use this punishment?
26% of primary teachers and 36% of secondary teachers are NOT allowed to take away break OR lunch, and this is very similar to the numbers reported in 2021: 23% and 37% respectively.
However, things have changed in primary schools: more teachers can keep students back at break AND lunch compared to 2021. Four years ago, 49% could keep students back at break AND lunch, but today that’s risen to 54%. This has been balanced by a drop in teachers restricted to keeping students in at break time only (DOWN 15% from 25%).
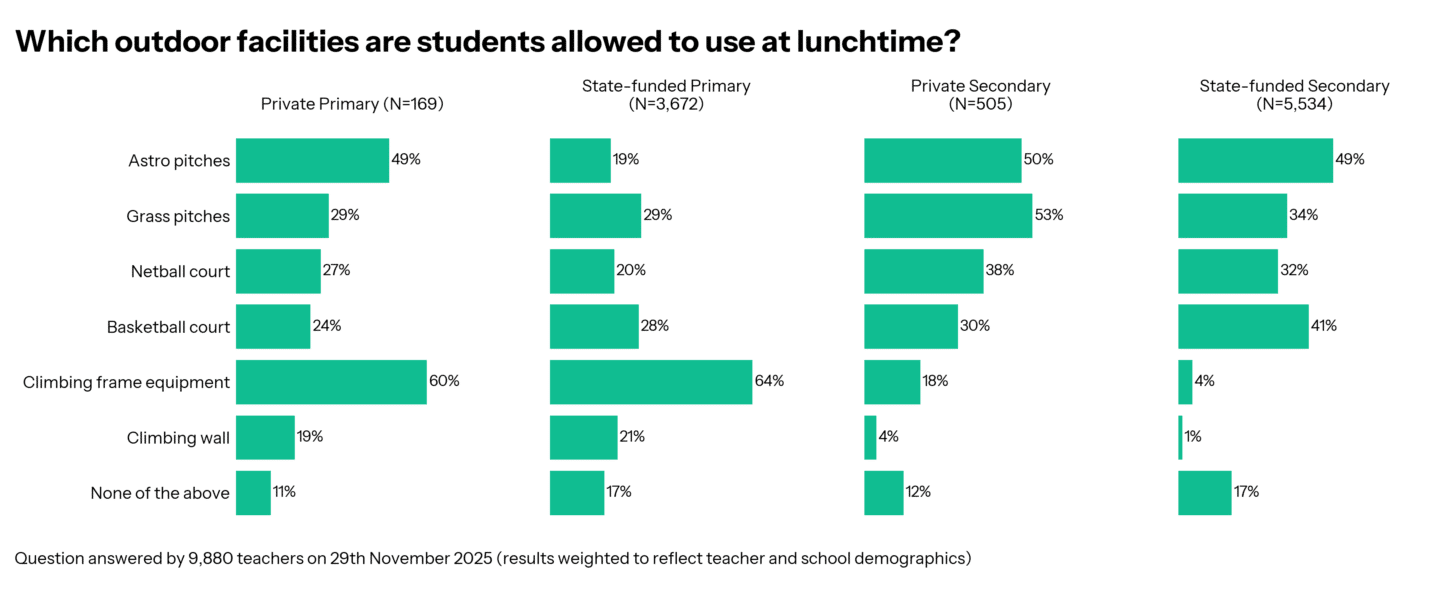
What can students do at lunchtime?
When students are out at lunchtime, what are they allowed to use? Access to astro pitches are more common in secondary than primary (49% in state secondary vs 19% state primary), whereas the classic climbing frame is still a staple in primary but not so common in secondary (64% in state primary vs 4% in state secondary).
Private schools tend to offer more access than their state school counterparts, with 53% of private secondary teachers reporting they give access to grass pitches, vs 34% of state secondary teachers. However, this isn’t true for all sports: 41% of teachers in state schools give access to basketball courts, but that is true for 30% of private secondary teachers.
Although this tells us what students have access to at lunch, it doesn’t give the full picture of what facilities schools have. Look out for more questions about netball courts and pitches!
This week the questions were all about students – but what are lunchtimes like for you? We would like to ask more questions about what your lunchtimes are like. If you have suggestions, shoot them over! Email us england@teachertapp.co.uk.
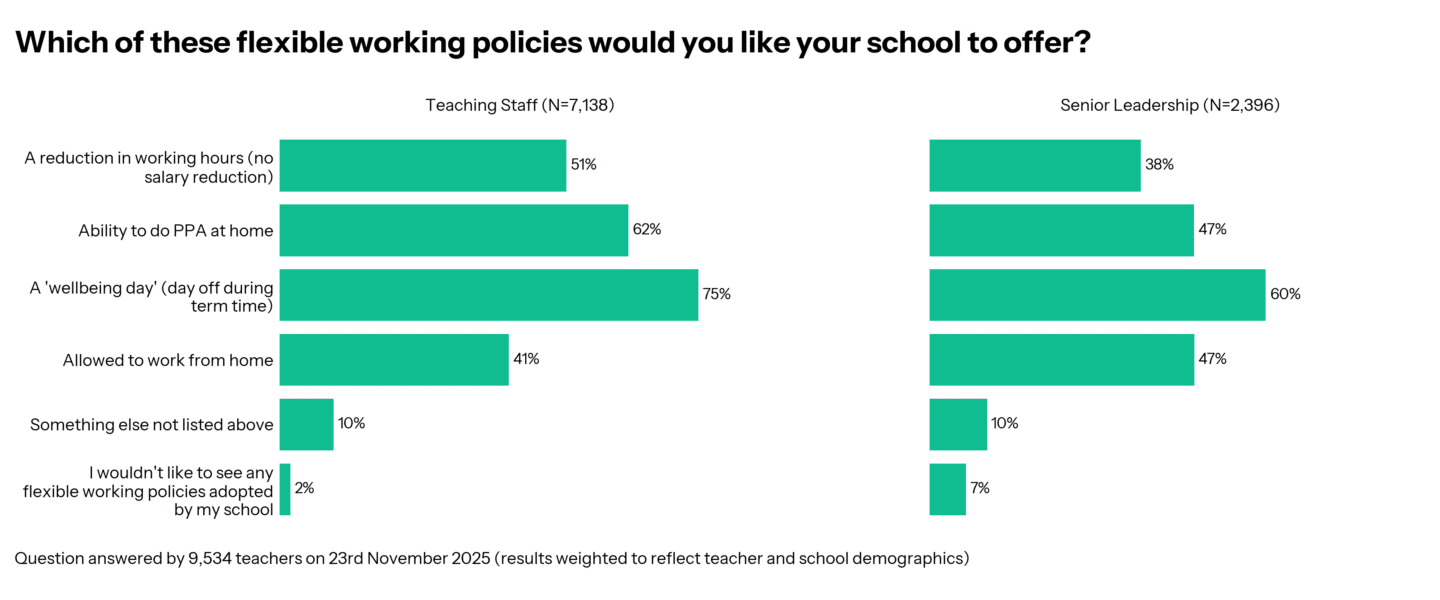
Flexible: what we have vs what we want
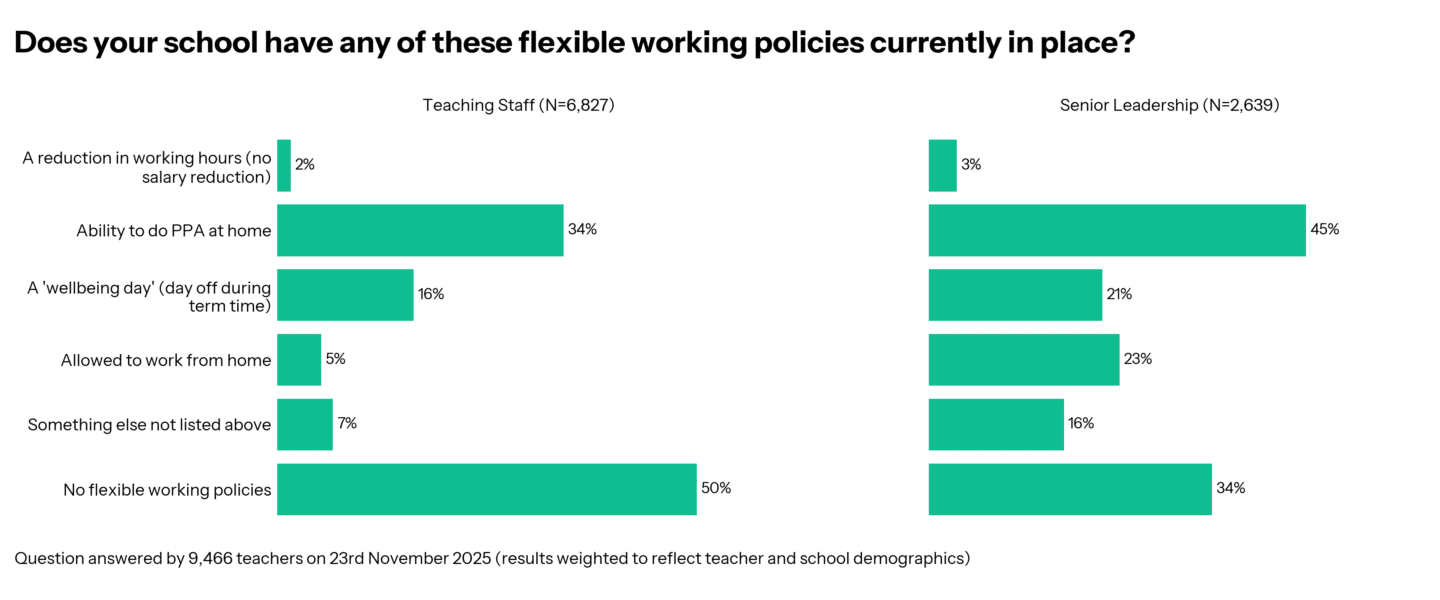
What do teachers really want when it comes to flexible working? One way to find out was to ask what is already in place in your school, and then what would you pick if you had free choice.
These results show a gap in flexible working provision. While half of classroom teachers say their school offers no flexible working options at all, only 2% say they wouldn’t like to see any introduced.
The biggest mismatches are around wellbeing days and reduced hours: three-quarters of teachers would like a wellbeing day during term time, yet only 16% have access to one, and 51% would like reduced hours with no salary reduction, compared with just 2% who say their school offers this.
Even working from home – wanted by 41% – is available to only 5%. The only policy where demand and provision come close is the ability to do PPA at home, available to around a third of teachers but wanted by nearly two-thirds.
Senior leaders report slightly better provision than classroom teachers do, suggesting something has gone awry here. One explanation could be a communication gap or differences in perception of what counts as “flexible working.” Or perhaps, flexible working options are only offered to senior members of staff.
+ BONUS finding
This week’s bonus finding comes from a Teacher Tapper who got in touch to ask about the wellbeing of SENCOs.
To work this out, we compared how SENCOs responded to two recent questions, compared to all other teachers.
First up, parent contact: SENCOs are more than TWICE as likely to describe parent contact as “unmanageable” compared to other teachers (42% vs 18%).
Next, we looked at the reasons why SENCOs have thought about leaving; SENCOs are more likely than other teachers to say they want to leave because the workload is too high (37% vs 28%).

Daily Reads
The top read this week from Tes on leadership wellbeing.
Got a blog you think we should feature? Email us at england@teachertapp.co.uk and we will check it out!